Version: 0.21.0This documentation is for Spitfire 0.21.0.
Observability (OpenTelemetry, Prometheus, Tempo, Jaeger, Loki)
A load test tells you "p95 went to 900 ms"; it does not tell you why. This page explains how
to get closer to the root cause by connecting the trace, metric and log data your systems already
produce: the OTLP receiver, Prometheus (and Grafana Mimir, Thanos, VictoriaMetrics), Tempo, Jaeger,
Loki, traceparent, the Backend tab on the run page, breaking-point findings and the resource
overlay on the charts.
What it does
- Spitfire installs no agent of its own. During a load test it reads the observability data your systems produce, through open standards and open tools only.
- It aligns that data with the run's load stages (VU levels or arrival-rate stages): "at the 450 VU stage orders-db p95 went 18 ms → 410 ms".
- When the system breaks, it ranks which resource saturated or jumped at that moment: "The system broke at 560 VUs; at the same time the orders-db connection pool filled up (pending connections 0 → 48) and checkout's CPU rose from 41% to 97%."
- With
traceparenton, it finds the test's slowest and failed requests in your traces.
Spitfire says "at the same time", never "because". It keeps measured and unmeasured apart; when there is no data, it says so.
When to use it
- When a threshold fails or a breaking point is found, to see where the bottleneck is.
- In a comparative run, to see in the backend why arm B is slower (Version comparison).
- If you already run an OpenTelemetry Collector, Prometheus, Tempo/Jaeger or Loki: the setup takes minutes.
Connection kinds
| Connection | Direction | What Spitfire uses |
|---|---|---|
| OTLP receiver | your OpenTelemetry Collector → Spitfire | traces, metrics (gauge, sum), error and warning logs |
| Prometheus (and compatibles: Grafana Mimir, Thanos, VictoriaMetrics) | Spitfire → /api/v1/query_range |
your PromQL: per-service latency (p95), error ratio, resources |
| Tempo | Spitfire → /api/search (TraceQL), /api/traces/{id} |
a sample of each stage's traces |
| Jaeger | Spitfire → query API /api/traces |
a sample of each stage's traces |
| Loki | Spitfire → /loki/api/v1/query_range |
metric LogQL counting error lines per service |
There are two ways of working:
- OTLP receiver (push): your Collector sends data to Spitfire. Spitfire keeps only data that falls into a run's window (from 30 s before its start to 60 s after its end).
- Query connections (pull): Spitfire queries only the run's window after the run ends (90 s later, for late data). An admin can recompute from the Backend tab.
Which one? If you already have a Collector, the OTLP receiver brings the richest data (traces, metrics and logs together). If you cannot touch the Collector, add query connections to your existing Prometheus/Tempo/Loki. Both can be used together.
Adding a connection
The Observability page is for admins only: Infrastructure → Observability in the left menu.
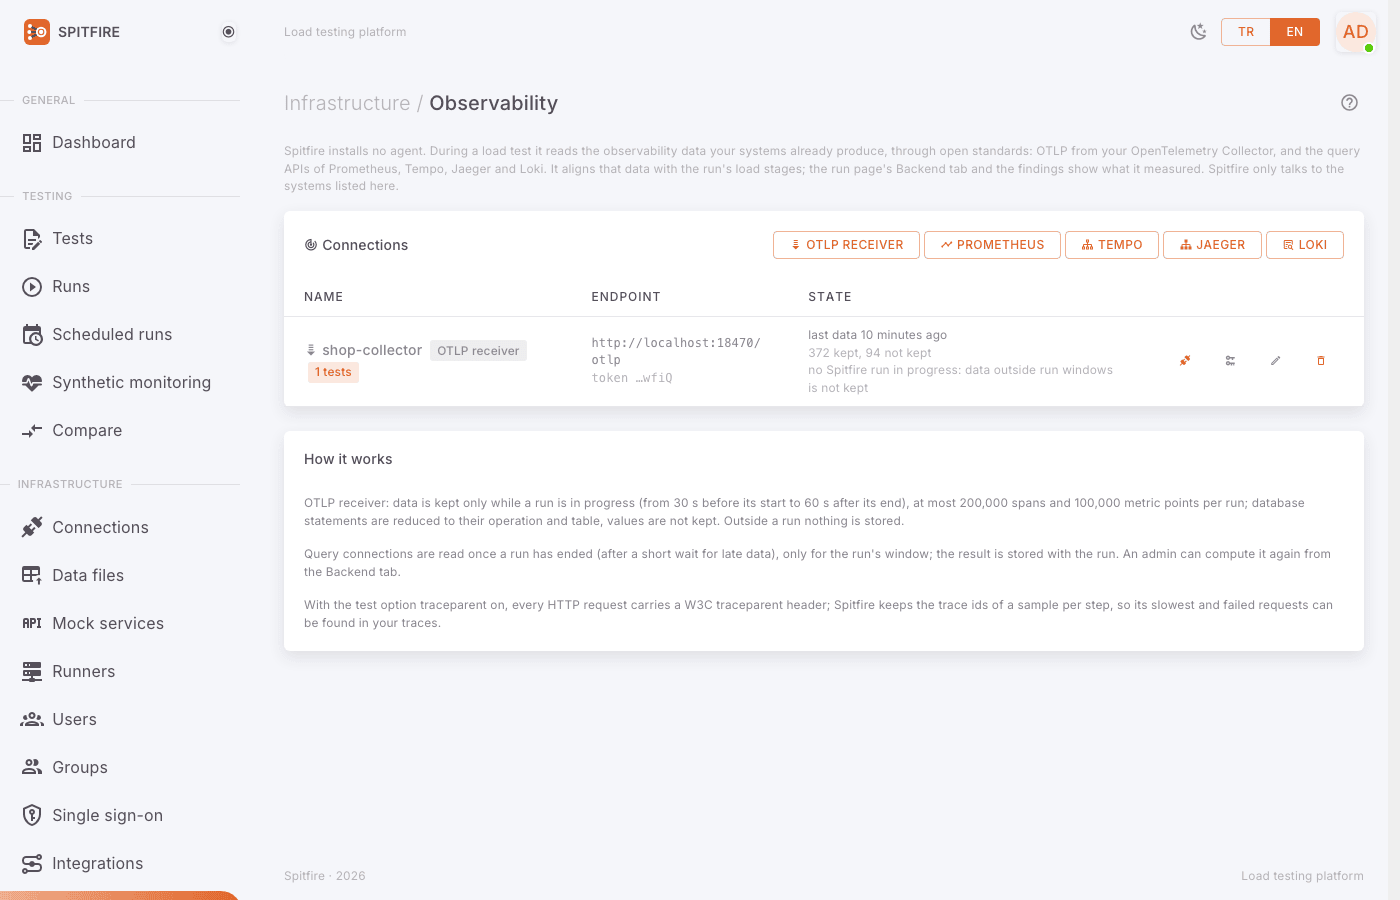 Observability page
Common steps:
- On the Observability page, press the button of the kind you want in the header of the Connections card: OTLP receiver, Prometheus, Tempo, Jaeger or Loki.
- Give it a Name (e.g. "prod-collector", "mimir-team-a").
- Fill in the fields for the kind (sections below).
- Keep On ticked and press Save.
- For query connections, press Test the connection on the list to check the address and credentials.
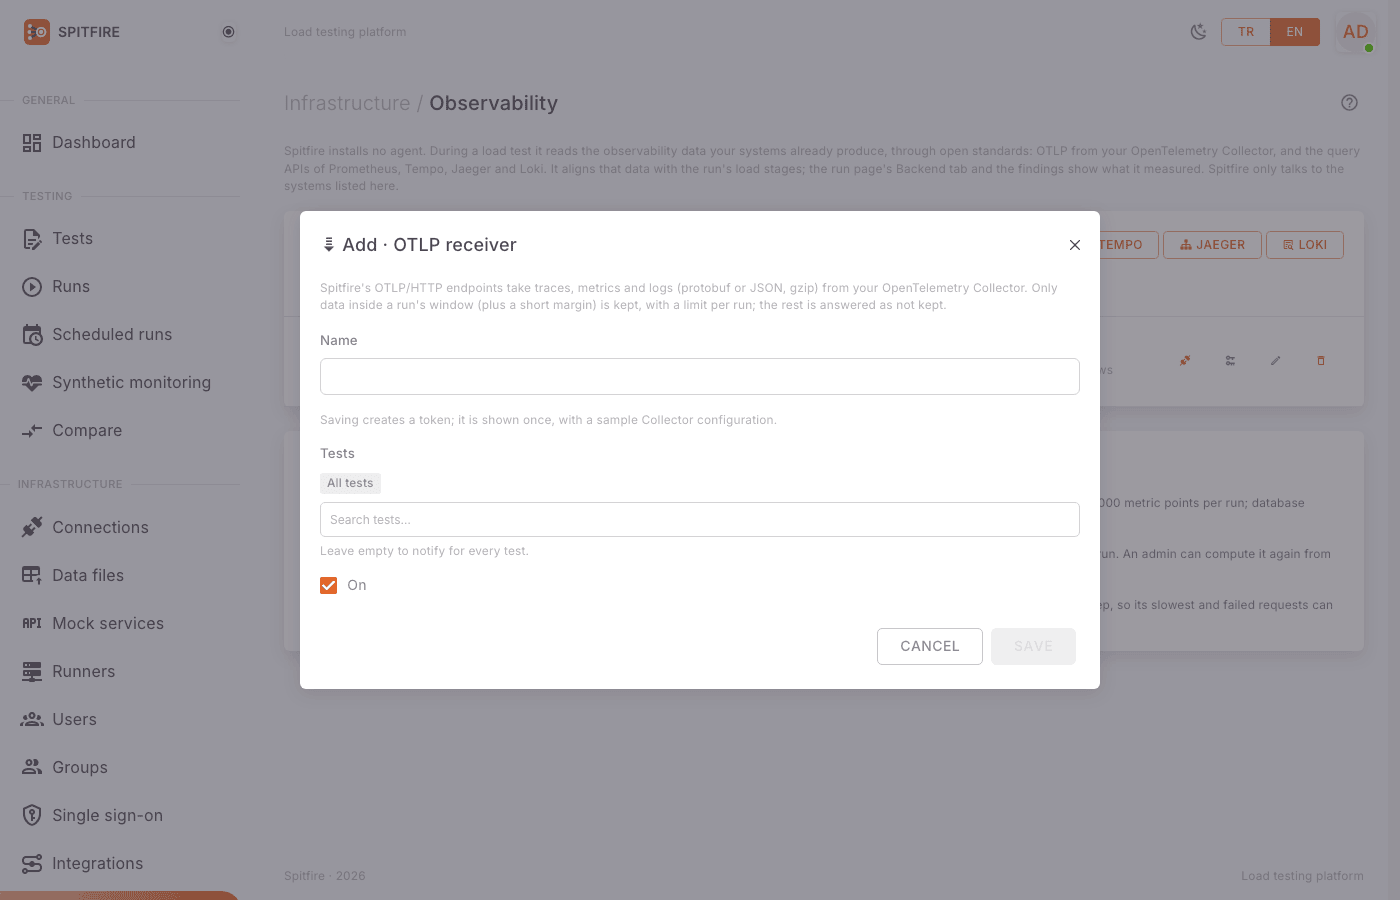 Add connection dialog
Tokens and passwords are encrypted with SPITFIRE_SECRET_KEY, like connection secrets. A stored
token or password is kept when left empty, as long as the address stays on the same server.
OTLP receiver (OpenTelemetry Collector)
Spitfire serves OTLP/HTTP on its HTTP port at /otlp/v1/traces, /otlp/v1/metrics and
/otlp/v1/logs (protobuf or JSON, gzipped or not).
Add → OTLP receiver, give it a name and save.
Saving generates a token (
sfotlp_…), shown once, with a sample Collector configuration. Copy the token now: it is not shown again (only its hash is stored).Add one exporter to your Collector, next to the existing ones:
exporters:
  otlphttp/spitfire:
    endpoint: https://spitfire.example.com/otlp   # the exporter appends /v1/traces etc.
    headers:
      Authorization: "Bearer sfotlp_…"
    compression: gzip

service:
  pipelines:
    traces:
      receivers: [otlp]
      processors: [batch]
      exporters: [otlphttp/spitfire]   # and your existing exporters
    metrics:
      receivers: [otlp]
      processors: [batch]
      exporters: [otlphttp/spitfire]
    logs:
      receivers: [otlp]
      processors: [batch]
      exporters: [otlphttp/spitfire]
Restart the Collector and press Done.
Start a run. The list shows "last data …" and "x kept, y not kept" next to the connection; data arriving outside a run is not kept (that is normal).
Limits: at most 200,000 spans and 100,000 metric points per run, 16 MB per request. The rest gets a
rejected answer (OTLP partial success), and the Collector does not retry. Database statements are
reduced to their operation and table (SELECT … FROM order_items); values are never kept.
If the token leaks, press New token on the list. The current token stops working at once; update the Collector's configuration with the new one.
Prometheus, Grafana Mimir, Thanos, VictoriaMetrics
One Prometheus connection serves them all; the query API's path prefix goes into the connection's URL.
- Add → Prometheus.
- Enter the Endpoint:
- Prometheus:
http://prometheus:9090 - Grafana Mimir: with the
/prometheusprefix, e.g.http://mimir-query-frontend:8080/prometheus. Spitfire callshttp://mimir-query-frontend:8080/prometheus/api/v1/query_range. - Thanos:
http://thanos-query:9090 - VictoriaMetrics:
http://victoria-metrics:8428
- Prometheus:
- Authentication: None, Bearer token, User name and password or Key in a header (with Header name).
- For a multi-tenant setup (Mimir) enter the tenant (e.g.
team-a) under Tenant (X-Scope-OrgID). - In Queries press Add a query for each one:
- What it measures: Latency (p95), Error ratio or Resource.
- Write the PromQL.
$__intervalis replaced with the query step. - An optional service (optional); for a resource, name (e.g. CPU) and unit. Without a service, each series is named by its service label.
- Use the Example: … buttons for ready-made queries.
- Save and press Test the connection.
PromQL examples:
# Per-service latency (seconds) — Latency (p95)
histogram_quantile(0.95, sum by (le, service_name) (rate(http_server_request_duration_seconds_bucket[$__interval])))

# Error ratio
sum by (service_name) (rate(http_server_request_duration_seconds_count{http_response_status_code=~"5.."}[$__interval])) / sum by (service_name) (rate(http_server_request_duration_seconds_count[$__interval]))

# Resource: CPU time
sum by (service_name) (rate(process_cpu_time_seconds_total[$__interval]))

# Resource: a pod's CPU against its limit (0.95 and above counts as saturated)
sum by (pod) (rate(container_cpu_usage_seconds_total{container!=""}[$__interval])) / sum by (pod) (kube_pod_container_resource_limits{resource="cpu"})

# Resource: requests waiting for a database connection (OpenTelemetry DB client metrics)
sum by (service_name, db_client_connection_pool_name) (db_client_connection_pending_requests)Root cause ranking gets the most out of CPU (against its limit), memory, requests waiting on a connection pool and queue depth (depth, lag, backlog). Add at least those as Resource.
Tempo
- Add → Tempo, enter the address (e.g.
http://tempo:3200) and, if needed, the authentication and Tenant (X-Scope-OrgID). - The TraceQL query runs for each load stage.
{}finds every trace; narrow it to your services:{ resource.service.name = "orders" }. - Traces per load stage: how many traces to read per stage.
Jaeger
- Add → Jaeger, enter the query API's address.
- Services: comma-separated service names. Empty: every service the query API lists (at most 20).
- Set Traces per load stage.
Loki
Add → Loki, enter the address and, if needed, the Tenant (X-Scope-OrgID).
Write a LogQL query that returns a metric grouped by the service label (
count_over_time,rate…):sum by (service_name) (count_over_time({service_name=~".+"} |~ "(?i)(error|exception|fatal)" [$__interval]))Service label: the label that names the service. Empty:
service_name,service,joborapp.
traceparent: finding the test's requests in your traces
With traceparent on in a test, every HTTP request carries the W3C traceparent header (sampled
flag set), unless the step sets one itself. Runners keep the trace ids of the slowest and the first
failed request per step and 10 s (at most 2,000 per runner, 5,000 per run). The Backend tab
finds those requests in your traces: the service's own duration and the slowest span below it.
To turn it on:
- Open the test with Edit and go to the Options tab.
- Under traceparent header choose On: W3C traceparent (sampled) on HTTP requests.
- Save.
In JSON:
{ "options": { "traceparent": "on" } }It is off by default: with it on, every test request asks for its trace to be kept. At load-test volume that can take room in your tracing backend. Turn it on with your trace storage in mind.
Make sure your services accept the incoming traceparent header and pass the trace context on
(context propagation); OpenTelemetry SDKs do this by default.
Reading the Backend tab
On the run page the Backend tab shows, per load stage:
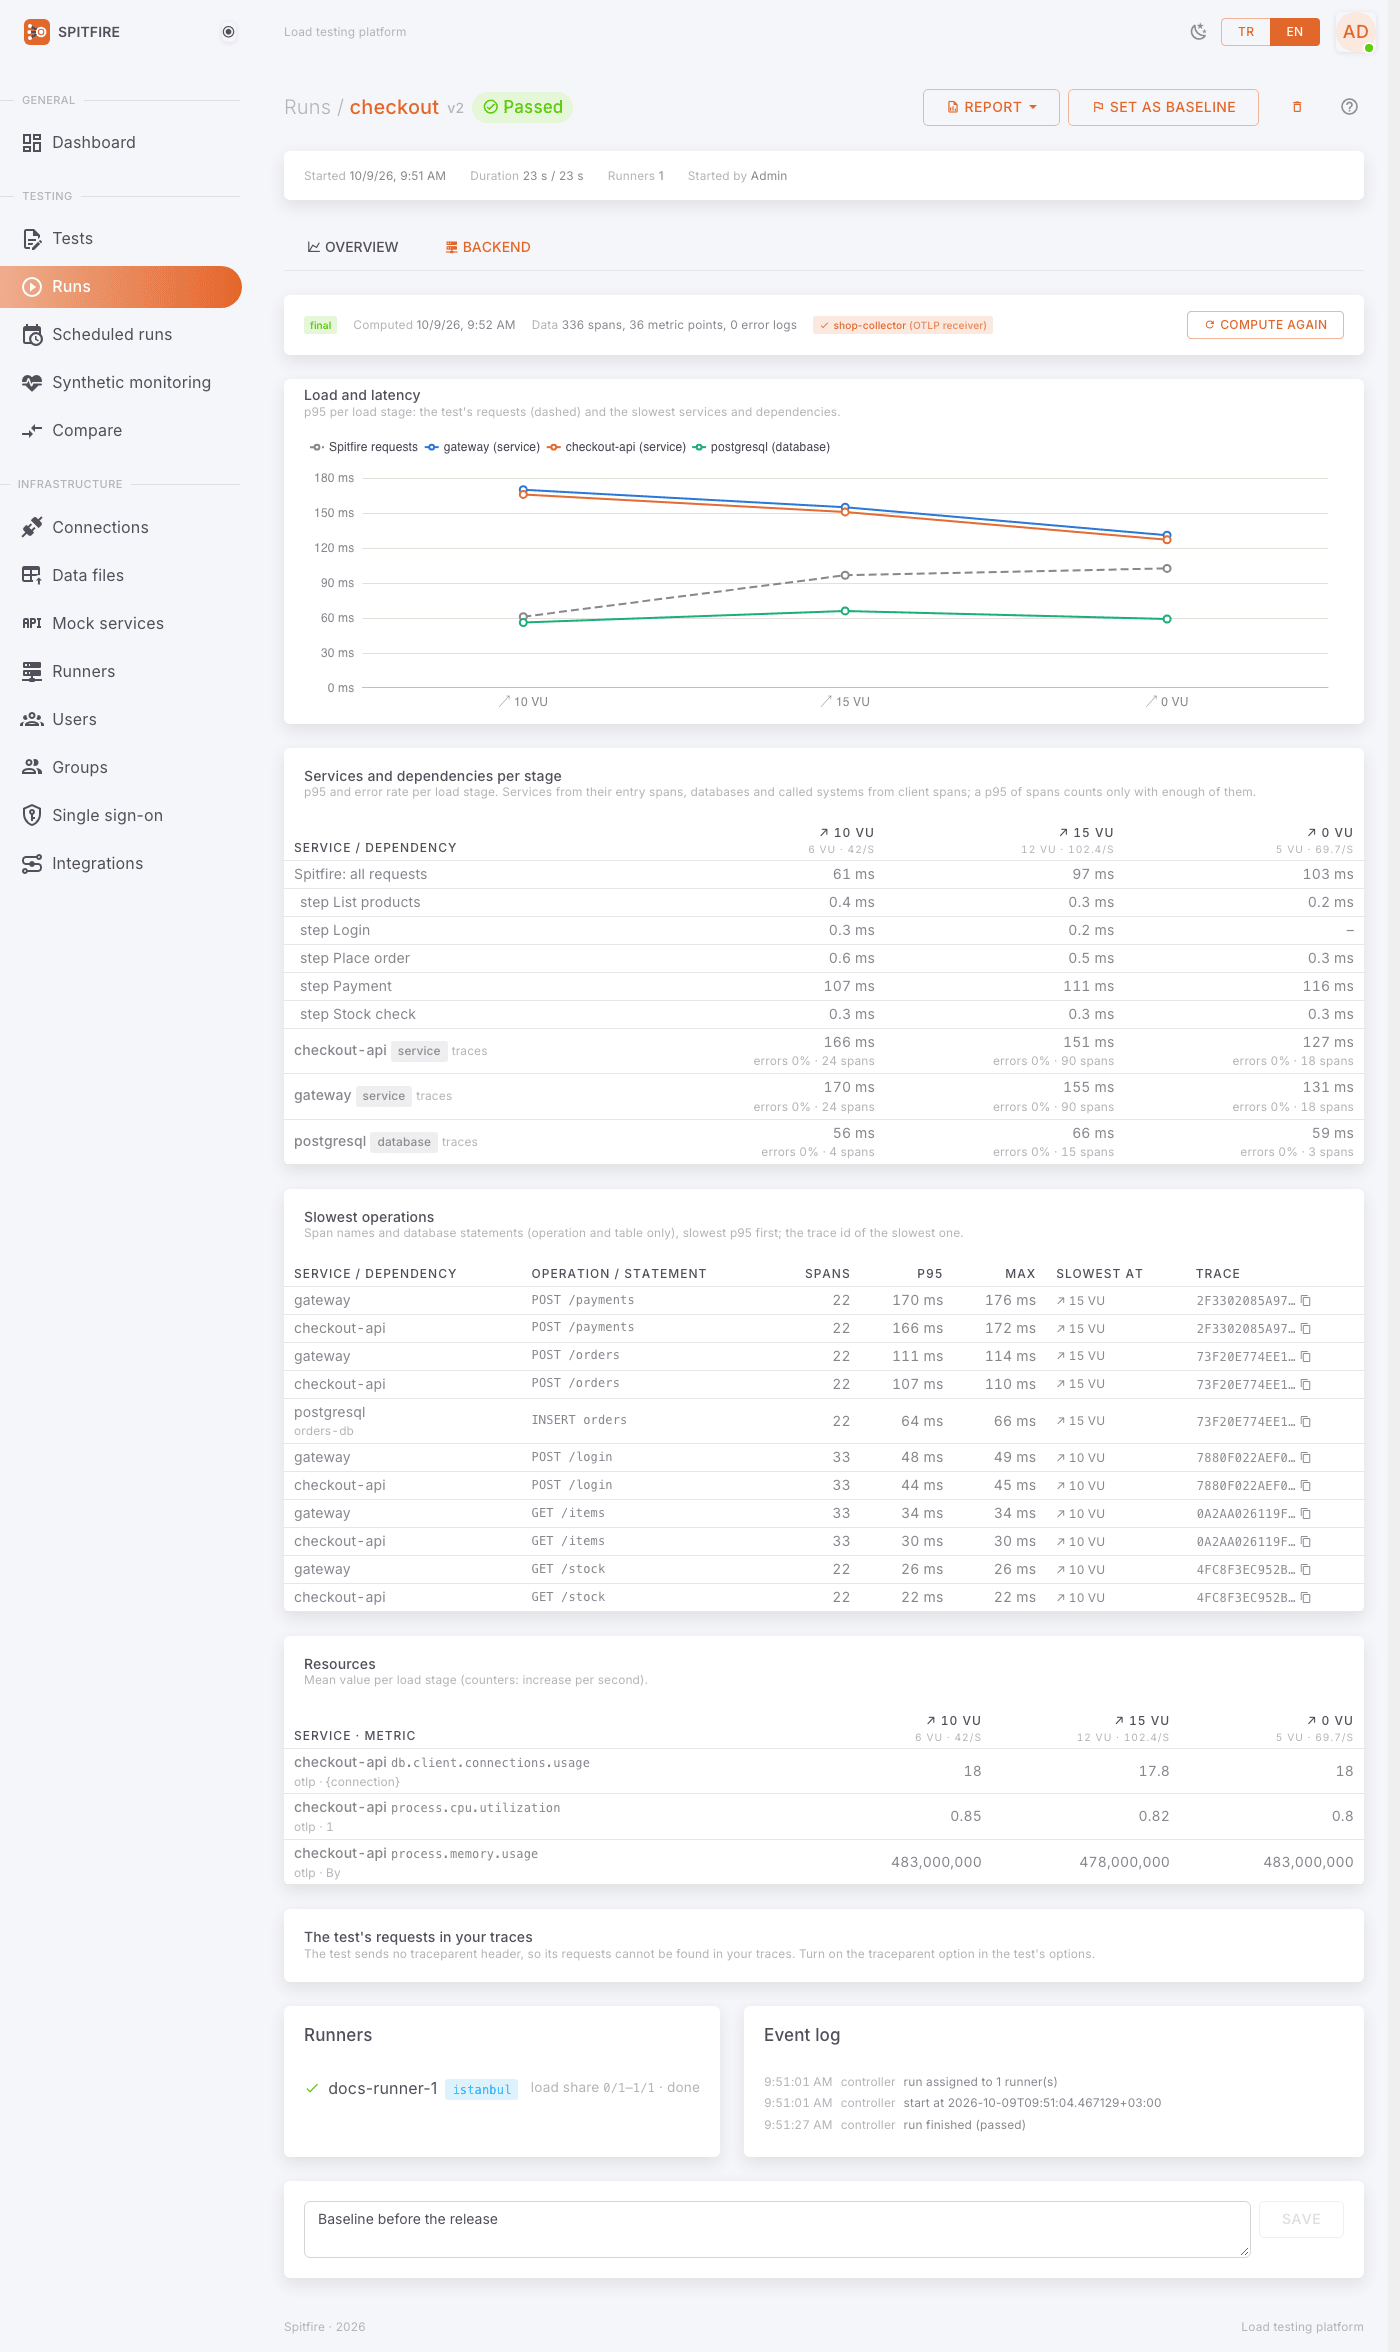 Backend tab
- At the top, the status: live: received data only (the run is going), waiting for late data, final or no connection. The Data line says how many spans, metric points and error records came in.
- Load and latency: p95 per load stage — the test's requests (dashed) and the slowest services and dependencies.
- Services and dependencies per stage: the p95 and error ratio of every service (entry spans), database and called system (client spans), or Prometheus query. The Spitfire: all requests row is there for comparison.
- Slowest operations: span names and database statements, highest p95 first; the Trace id of the slowest (copy it and open it in Tempo/Jaeger).
- Resources: the mean value per load stage (counters as their per-second increase).
- Error logs: error records per service and stage, with samples.
- The test's requests in your traces: how many trace ids were kept and found; for each, Test's time, Service's time and Slowest span under it.
Compute again at the top right (admins) re-reads the query connections, e.g. after you fixed a query.
Backend findings follow the run findings' rule: only what the data shows, with its numbers. Example:
At the 450 VU stage orders-db (database) p95 18 ms → 410 ms (240 spans). At the same time the checkout step crossed its threshold: p95 520 ms, limit 300 ms. Slowest operation:
SELECT … FROM order_items.
Root cause ranking (breaking point)
When a run breaks — a failed p95 or error-rate threshold (req_duration p(95)<…,
req_failed rate<…; for the whole run or a step) or the step a breakpoint run could not pass —
Spitfire takes the load stage where it broke and the previous stage of the same kind, and ranks
every resource series from every connected source:
- absolute saturation: CPU at 95% of its limit or more, memory at 90% or more, requests waiting for a pool connection (above zero and grown), a queue (depth, lag, backlog) that at least doubled and passed 10;
- then the largest relative jump against the previous stage (at least 1.5×; rising from zero counts as the largest).
The top three go into one finding:
The system broke at 560 VUs (p95 threshold failed: 900 ms, limit 500 ms); at the same time the orders-db connection pool filled up (pending connections 0 → 48) and checkout's CPU rose from 41% to 97%.
If no series moved it says so; if there was no resource data for that moment it says that. A breakpoint run that stopped on its VU limit (not the system) has no breaking point. The ranking is deterministic: the same data always gives the same finding.
Resource metrics on the charts (overlay)
On the run page, Show resource metrics on the charts:
- Tick it.
- Pick a series from Resource series (a Prometheus resource query or an OTLP metric; counters as their per-second increase).
- The series is drawn on the run's own charts — request rate, VUs, response time, error rate — as a dashed line on its own right axis, aligned in time; the start of each load stage is marked with a dotted vertical line.
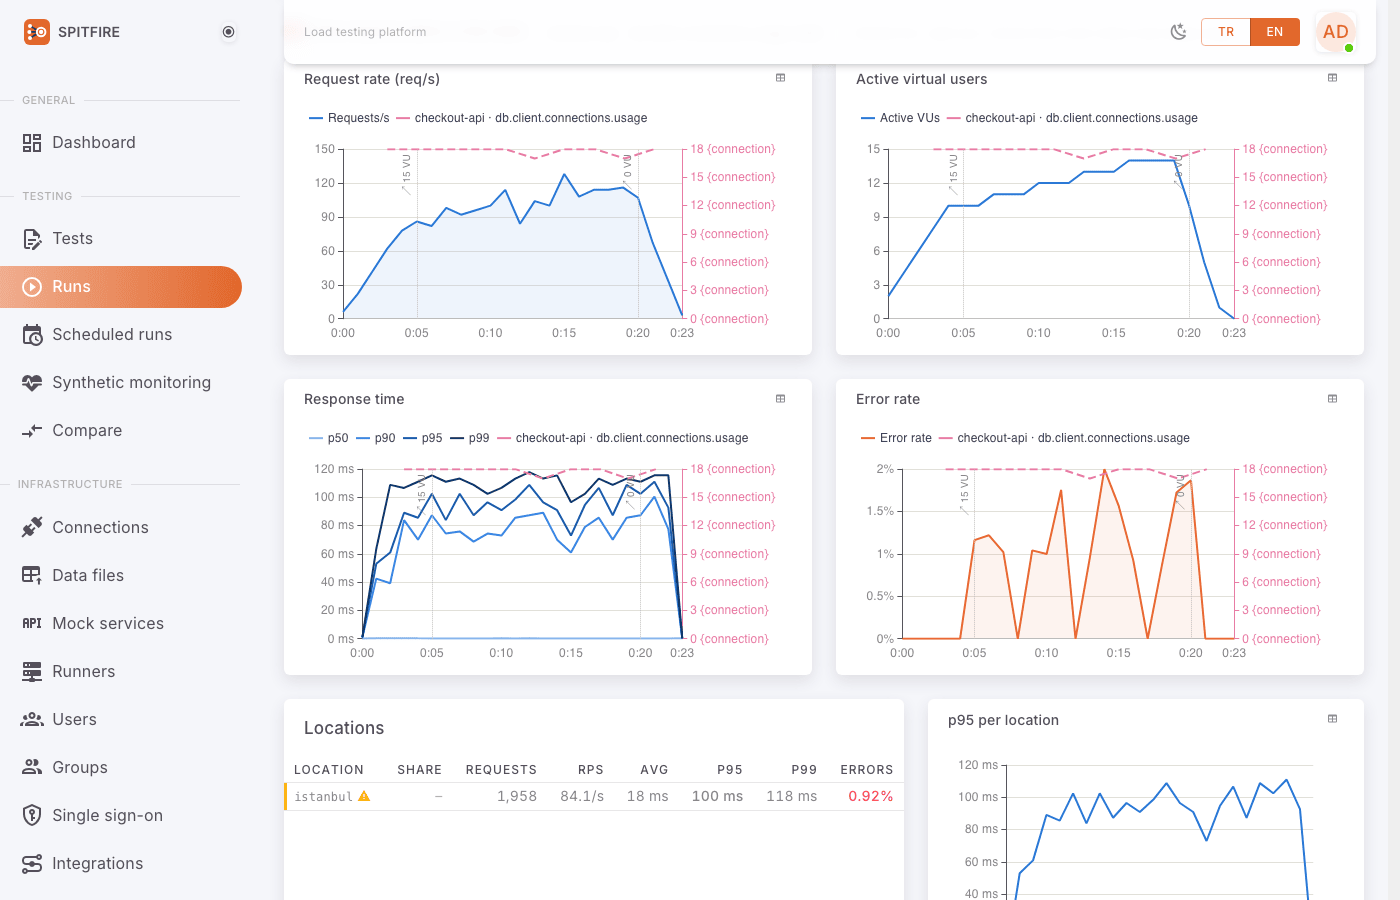 Resource overlay
You see in one chart whether the response time shot up exactly when CPU passed 90%.
Retention
Raw data received over OTLP is pruned together with the run logs; the computed result (Backend tab, findings) stays with the run. Removing a connection does not delete data kept for past runs.
Common problems
| Symptom | Cause | Fix |
|---|---|---|
| No observability connection for this test | No connection defined | An admin adds one on the Observability page (Set up observability). |
| No backend data in this run's window | The Collector does not send, or the queries are empty for that time | Check the Collector's logs; is the token right (Authorization: Bearer sfotlp_…), does the endpoint end in /otlp? Press Test the connection for query connections. |
The Collector gets 401 |
Wrong token, or it was replaced with New token | Update the header in the Collector with the current token. |
| The list keeps showing "y not kept" | Data arrives outside a run window, or the per-run limit was reached | Data outside a run is not kept; that is normal. If the limit was reached, sample in the Collector. |
| A "… could not be read" finding | Wrong address, credentials or tenant on a query connection | See the error with Test the connection; for Mimir check the /prometheus prefix and the Tenant. |
| The latency query is empty | The metric has another name in your system | Try the query in Grafana/Prometheus first, with a fixed range instead of $__interval. |
| "The test's requests were not found in the traces" | Services do not take traceparent, or sampling drops those traces |
Check context propagation and the sampler (a parent-based sampler honours the sampled flag). |
| "The test sends no traceparent header…" | The test's traceparent option is off | Options tab: traceparent header → On. |
| The breaking-point finding says there was no resource data | No CPU, memory, pool or queue metric | Add Prometheus Resource queries or OTLP metrics from the Collector. |
| No series in the overlay | No resource query or OTLP metric | Add a Resource query; wait 90 s after the run ends. |
| The tracing backend fills up | With traceparent on, every request keeps a trace |
Turn it on only for the tests that need it; shorten the trace retention. |
Related pages
- Version comparison — the backend behind a difference
- Mock, chaos and capacity — a capacity estimate from a breaking point
- Schedules and monitoring — Spitfire exporting its own metrics
- Troubleshooting
- Observability
In Spitfire: /observability