Version: 0.21.0This documentation is for Spitfire 0.21.0.
Schedules, synthetic monitoring and notifications
This page covers three related features:
- Scheduled runs — running a test regularly on a cron schedule (e.g. every night at 02:00).
- Synthetic monitoring — running a test at a low load, at short intervals, against a live system, to keep asking "does it work?".
- Notification channels — taking the results of runs, schedules and monitors to people and systems via Slack, Microsoft Teams, e-mail, SMS or webhook.
Suggested order: set up a notification channel first, then create the schedule or monitor. That way you hear about the first problem.
What it does
- A schedule load-tests regularly without a pipeline: "run the load test every night and tell me in the morning if something got worse."
- Synthetic monitoring notices a breakage before your users do: "do sign-in, add to cart and the checkout page work right now?" Each check is short and light; no full run record is made.
- Notifications take the result to where the team already looks, and can work "on problems only" to avoid alert fatigue.
When to use it
| Need | Use |
|---|---|
| A full load test every night or week | Scheduled run |
| A test on every deploy or PR | CI/CD |
| A minute-by-minute health check of the live system | Synthetic monitoring |
| Comparing two versions every night | Scheduled run + Start a comparative run |
| Results in Slack/Teams/e-mail/SMS | Notification channel |
| Results as JSON in your own system | Webhook (JSON) channel |
Creating a scheduled run
A scheduled run runs the test on behalf of the user who created it and with that user's current permissions. If the user loses access or is disabled, the schedule does not run.
Step by step:
- Open the test from the Tests page.
- Press Schedule at the top. The New schedule dialog opens.
- Give it a Name (e.g. "Nightly load test"). An empty run note uses this name.
- Under When pick a preset:
- Every hour
- Every night 02:00
- Weekdays 09:00
- Mondays 03:00
- Custom (cron) — write a 5-field cron expression: minute hour day month weekday.
Example:
30 1 * * 1-5= weekdays at 01:30.@daily,@hourly,@weeklywork too.
- Pick the Time zone (e.g.
Europe/Istanbul). The cron expression is read in this zone. - Enter the number of Runners.
- Optionally, in Environment and scale, choose one of the test's environments (Environment), a Load scale, and variables to change for these runs. The test does not change; the differences apply only to the scheduled runs.
- The Next runs list in the dialog shows when your expression will really fire. Always check it before saving.
- Optionally fill in Run note (default: the schedule's name).
- If the test changes data, tick If this test changes data, I allow that for the scheduled runs too. Without it, a test that changes data does not start from the schedule.
- Make sure Enabled is ticked and press Save.
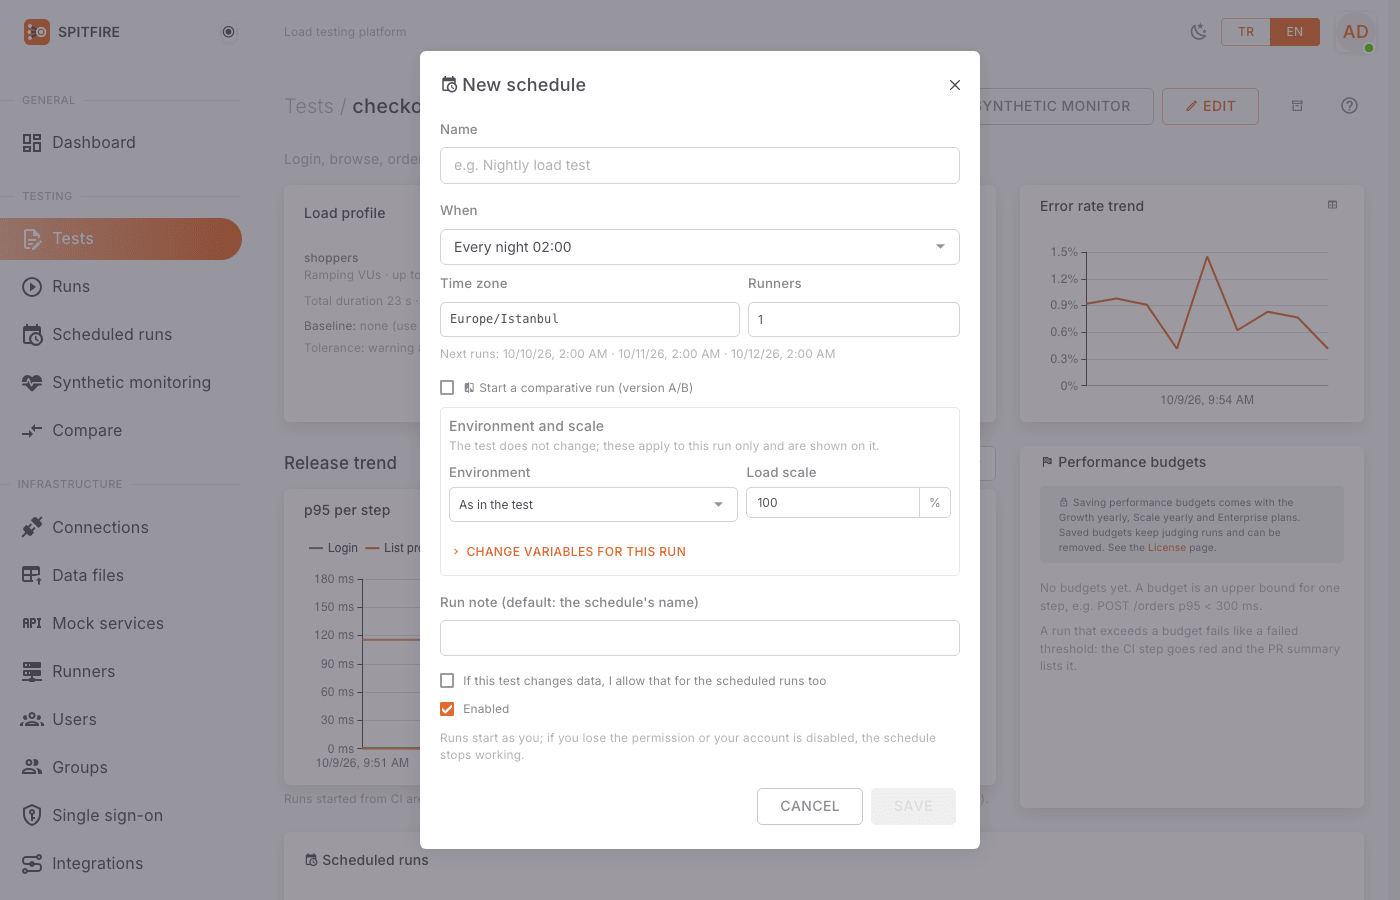 New schedule dialog
Schedule rules
- A schedule may run at most every 5 minutes. A more frequent expression is refused with "A schedule may run at most every 5 minutes."
- A firing while the schedule's previous run is still going is skipped (skipped).
- Times missed while the controller was down are not made up: a run more than 10 minutes late is marked missed.
- A run that cannot start (no idle runner, license limit, writes not confirmed) is marked
did not start and is reported to channels subscribed to
schedule.failed.
Managing scheduled runs
Testing → Scheduled runs in the left menu lists every schedule: test, when, the Next firing, the Last status (started, skipped, missed, did not start) and the Owner.
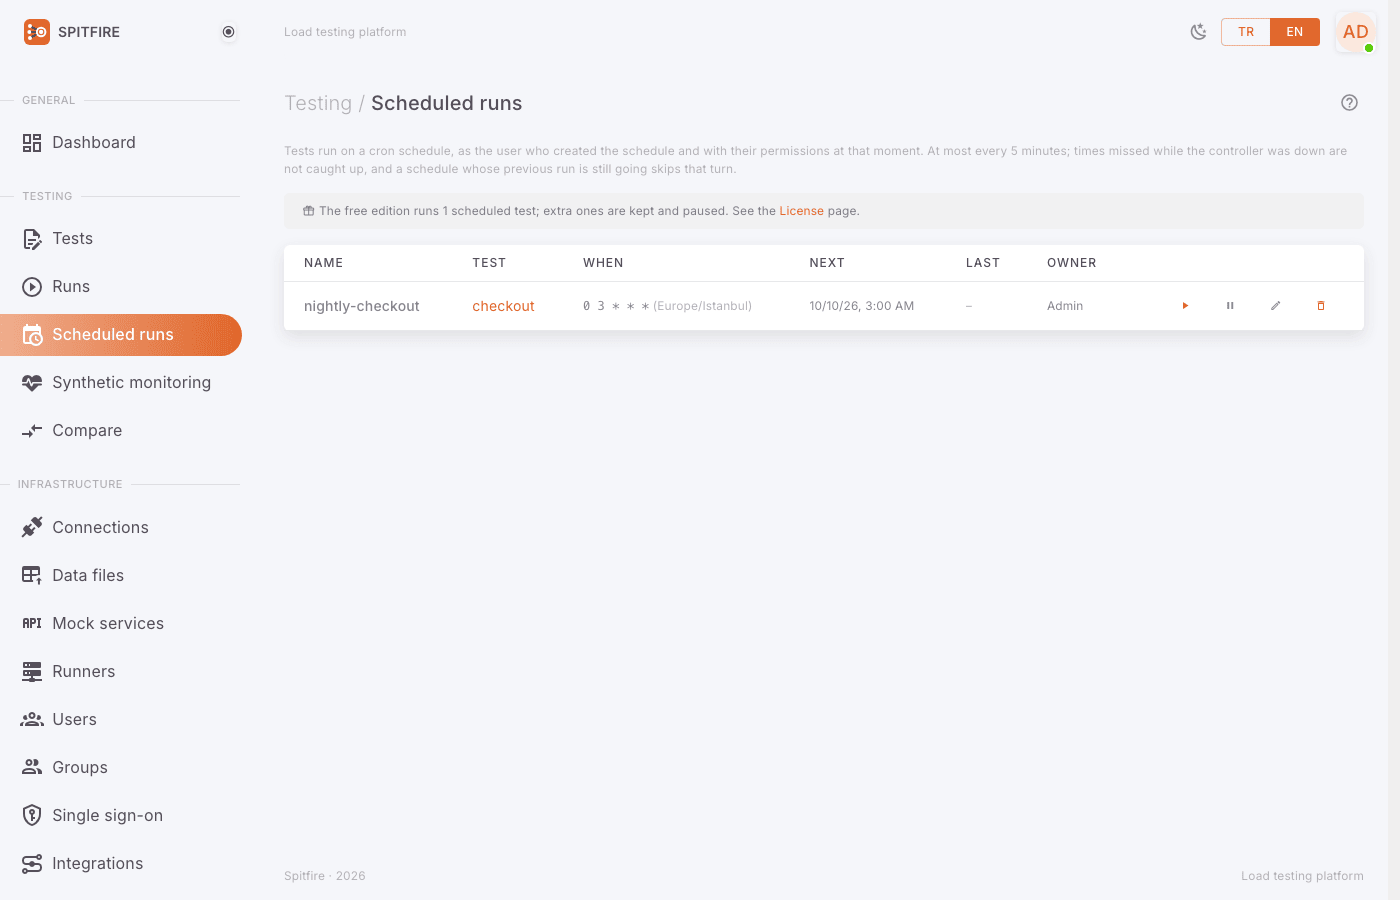 Scheduled runs page
On each row:
- Run now — fires it once without waiting (ideal for trying it out).
- Pause / Resume — stops and restarts the schedule without deleting it.
- Edit — opens the same dialog.
- Delete — deletes the schedule; the runs it started stay.
- run → — goes to the latest run it started.
Scheduled comparative runs
A schedule can start a comparative run (version A/B) instead of a plain run: "every night, dev against test".
- In the schedule dialog tick Start a comparative run (version A/B).
- Choose the environment for Arm A (reference) and Arm B (candidate).
- Optionally write a Version label per arm. An empty label takes what the environment's version endpoint reports.
- If you have a single environment, or the environments share resources, turn on Sequential comparison (the arms take turns). A scheduled sequential comparison on one environment needs the environment's version endpoint, because nobody is there to confirm the switch.
- Save.
Each firing runs the test against both environments at the same time, each arm with half the
load. A "worse" or "invalid" result goes to the notification channels as run.compared; on the
list, comparison → links to the latest one. Details: Version comparison.
A scheduled comparison needs the compare_ci license feature (Growth yearly, Scale
yearly, Enterprise). The free edition allows 1 scheduled test.
Creating a synthetic monitor
A synthetic monitor runs the test at a low load, on an interval, against a live system. At every check each VU runs every scenario once (at most 60 s). No run record is made; only a summary is kept: passed / slow / failed, the duration of the whole check and of each step, one error sample and the location.
Step by step:
- Open, from the Tests page, the test of the flow you want to watch (e.g. sign-in + add to cart + checkout page).
- Press Run as synthetic monitor at the top. The New synthetic monitor dialog opens.
- Give it a Name.
- Pick the Interval: 1, 5, 15 or 60 minutes. The free edition allows at most every 15 minutes; shorter options show a paid plans label.
- VUs: 1–10 (default 1). A synthetic monitor is not a load test; keep it small.
- Locations: pick one or more. Each chosen location runs its own check (on an idle runner there). Without one, any idle runner is used.
- Environment: which environment the test runs with. The test's own values uses the values in the test.
- Fill in Alerts:
- Bad checks in a row: after how many bad checks the alert goes out (e.g. 2 or 3, so a single network blip does not page anyone).
- Check duration threshold (ms): a whole check longer than this counts as slow.
- Step duration threshold (ms): any step longer than this makes the check slow.
- Leave them at none if you do not want a threshold.
- If the test changes data, the This test changes data warning appears (see below).
- Keep Enabled ticked and press Save.
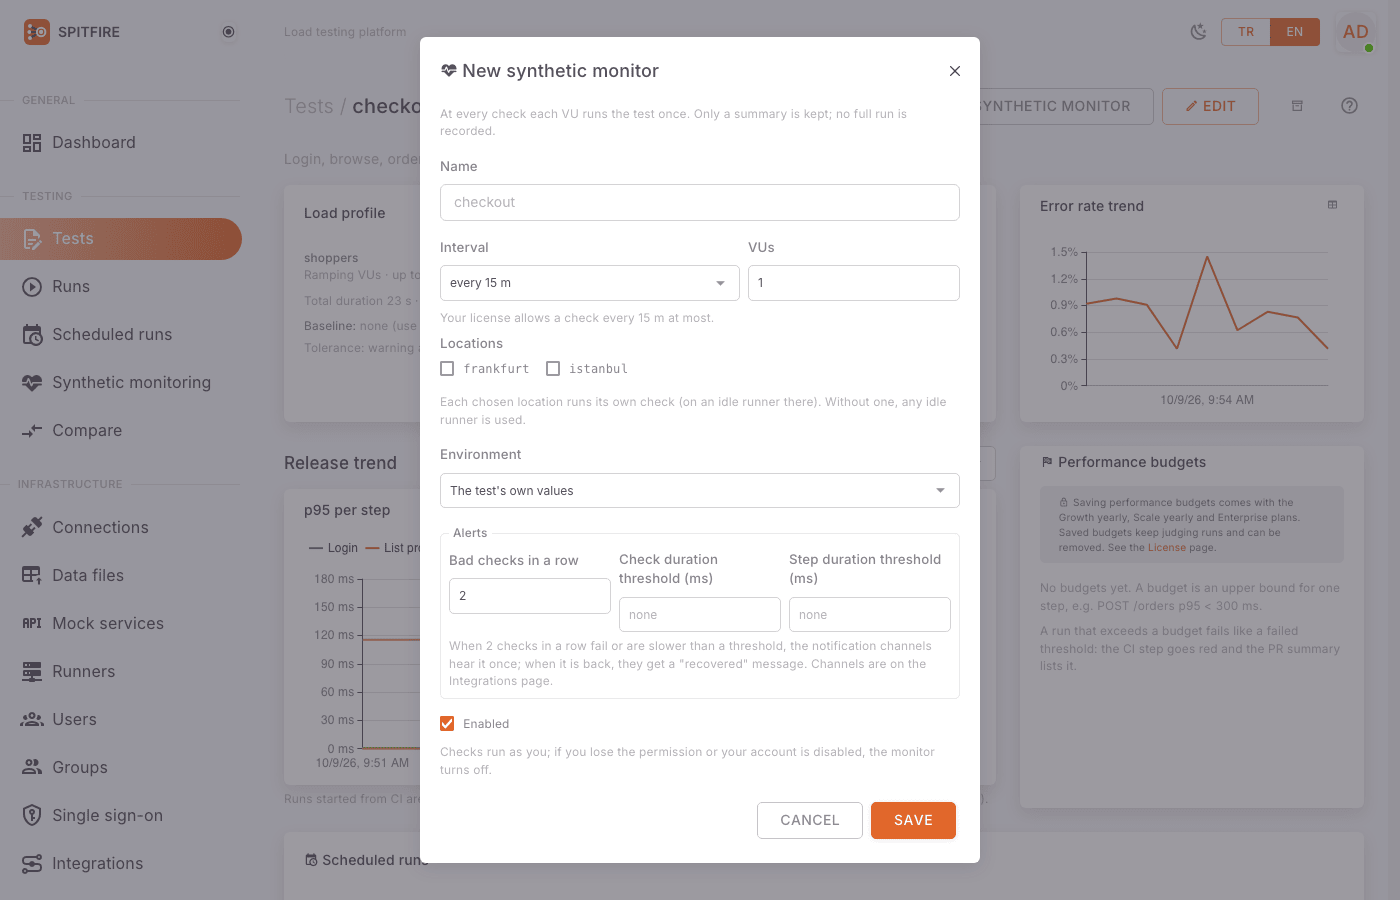 New synthetic monitor dialog
After saving, press Check now on the list. Once "Check started; its result shows here within a minute." appears you will see the first result, and you know the settings are right without waiting for the interval.
Write protection
A test with a step that changes data (SQL/Mongo writes, a dangerous Redis command, an HTTP request marked as modifying data) needs explicit confirmation in a monitor, whatever the environment. A synthetic monitor repeats those steps against the live system at every check: 1440 times a day at a 1-minute interval.
- The dialog shows the This test changes data heading and its explanation.
- Without ticking I allow these steps to change data at every check the monitor is not created.
- If the test starts writing later (a write step is added), the monitor is turned off.
If you can, write a read-only test for monitoring. Writing a fake order into the live system every minute is rarely what you want.
How checks work
- Checks run on behalf of the user who created the monitor, with that user's current permissions; a user who loses access has their monitor turned off.
- A check never overlaps the monitor's previous check.
- With no idle runner the check counts as skipped and does not enter the uptime. If all your runners are busy in long load tests, monitor checks are skipped; consider a separate runner or location for monitoring.
- Checks run through the normal orchestration (runner choice, license check, connections). On the Runners page a runner doing a check shows as a synthetic monitor check.
- Checks are kept for 30 days (7 days on the free edition) and pruned by the daily maintenance.
Reading a monitor dashboard
Testing → Synthetic monitoring in the left menu lists every monitor: State, Interval, Locations, Last check, Owner.
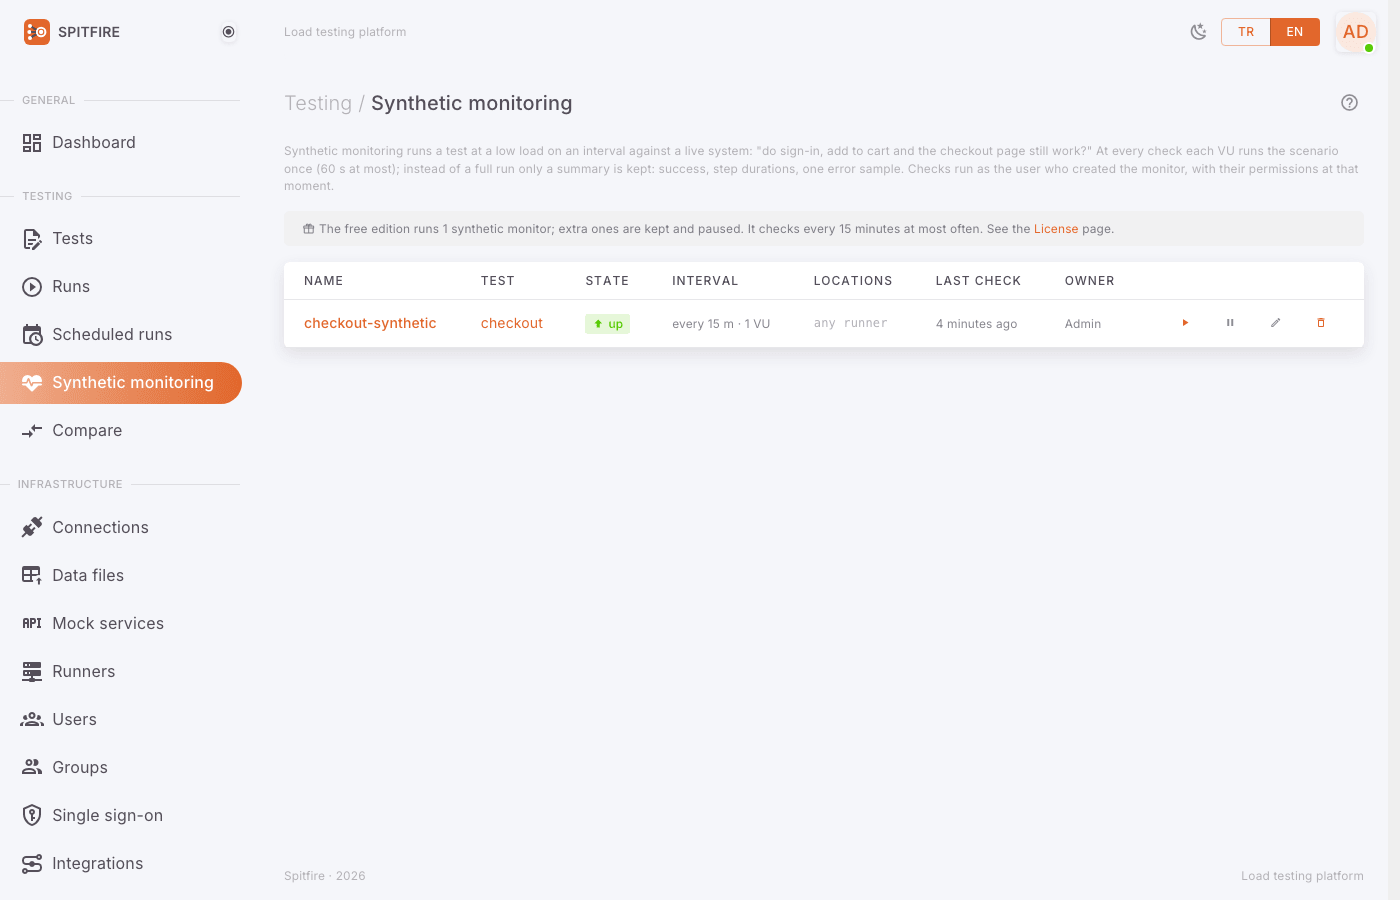 Synthetic monitoring list
States:
| State | Meaning |
|---|---|
| up | The latest checks passed |
| slow | A check or step duration threshold was exceeded |
| down | Checks fail (the bad-checks-in-a-row threshold was reached) |
| unknown | No check yet, or all were skipped |
| paused | The monitor is paused |
Click a monitor's name to open its dashboard:
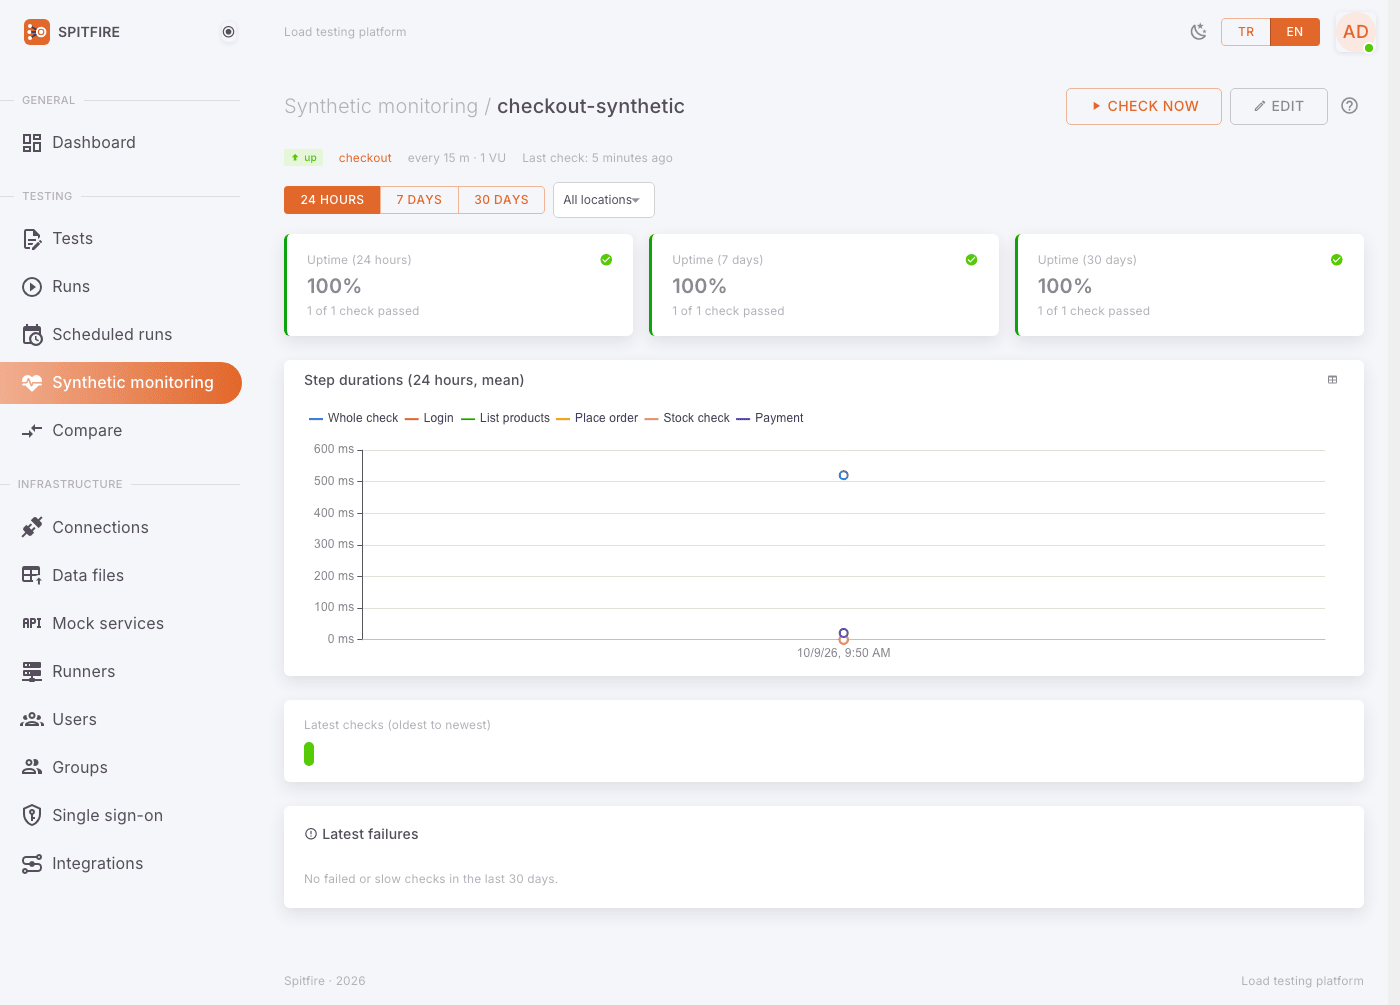 Monitor dashboard
- At the top pick the Time range (24 hours, 7 days, 30 days) and the Location (All locations or one).
- The Uptime boxes show the 24-hour, 7-day and 30-day ratio and "x of y checks passed".
- The Step durations chart shows each step's mean duration over time; the Whole check line is the total. This is where you see a step slowly getting slower.
- Latest checks (oldest to newest) lists each check with its result (passed, slow, failed, skipped), duration and runner.
- Latest failures shows failed and slow checks with an Error sample: which step, how many requests failed, which checks failed.
- While a problem lasts, the top says "Incident open since …".
Alerts and recovery notices
- After N bad checks in a row (failed, or slower than a threshold), the notification channels get
monitor.downonce per problem. You do not get a message on every bad check. - When the monitor recovers,
monitor.recoveredgoes out once. - Disabled channels and channels paused by the license get nothing.
- Make sure the channel subscribes to
monitor.downandmonitor.recovered(on by default for SMS channels).
Notification channels
The Integrations page (admins, Infrastructure → Integrations in the left menu) tells other systems and people about runs.
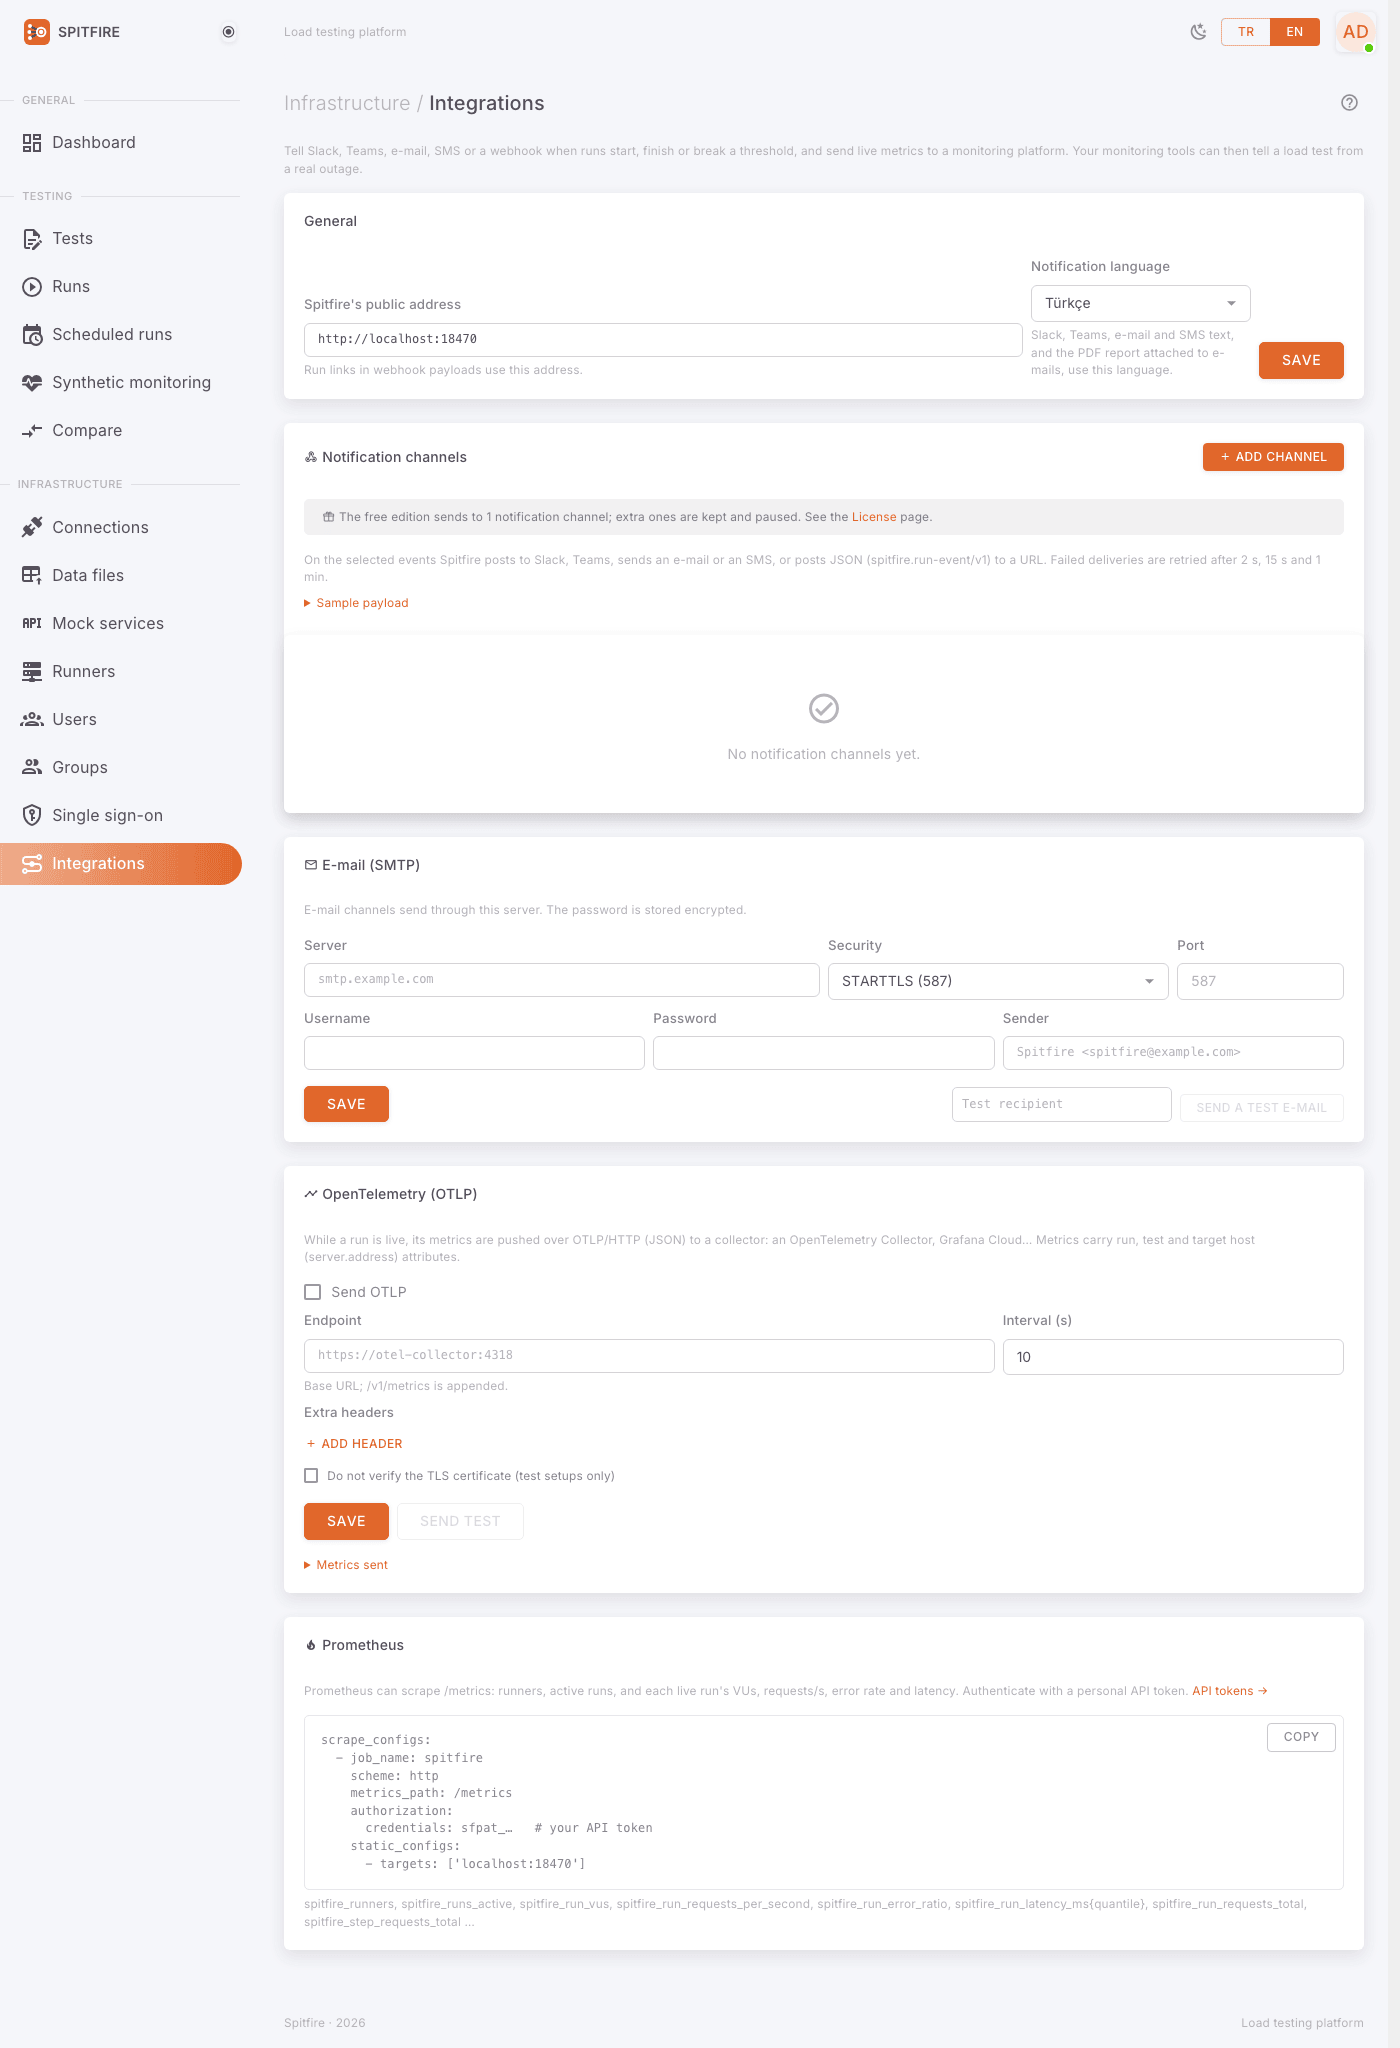 Integrations page
General settings first
- In the General card enter Spitfire's public address (e.g.
https://spitfire.example.com). Run links in notifications are built from it; if it is wrong, the links in the messages do not open. - Choose the Notification language. Slack, Teams, e-mail and SMS text, and the PDF report attached to e-mails, use this language.
- Press Save.
Adding a channel (common steps)
In the Notification channels card press Add channel.
Choose the Channel kind: Webhook (JSON), Slack, Microsoft Teams, E-mail or SMS (HTTP).
Give it a Name (e.g. "Team Slack channel").
Fill in the target for its kind (sections below).
Under Events choose what it receives:
Event When run.starteda run started run.finisheda run finished (with summary and thresholds) run.regresseda run was clearly worse than the test's baseline run; sent after run.finishedrun.compareda comparative run (version A/B) finished; with the verdict and largest differences run.switch_neededa sequential comparison waits for a version switch (optional, for deploy pipelines) schedule.faileda scheduled run did not start or was missed monitor.downa synthetic monitor is down or slow (once per problem) monitor.recovereda synthetic monitor recovered To avoid alert fatigue tick Only notify on problems: runs that pass and run starts are not sent; runs that break a threshold, fail or are stopped, regressions against the baseline, worse or invalid comparisons and scheduled runs that did not start are.
Under Tests you may pick specific tests. Left empty (All tests), every test's runs are reported.
Keep Enabled ticked and press Save.
Use Send test next to the channel and see the result under Deliveries.
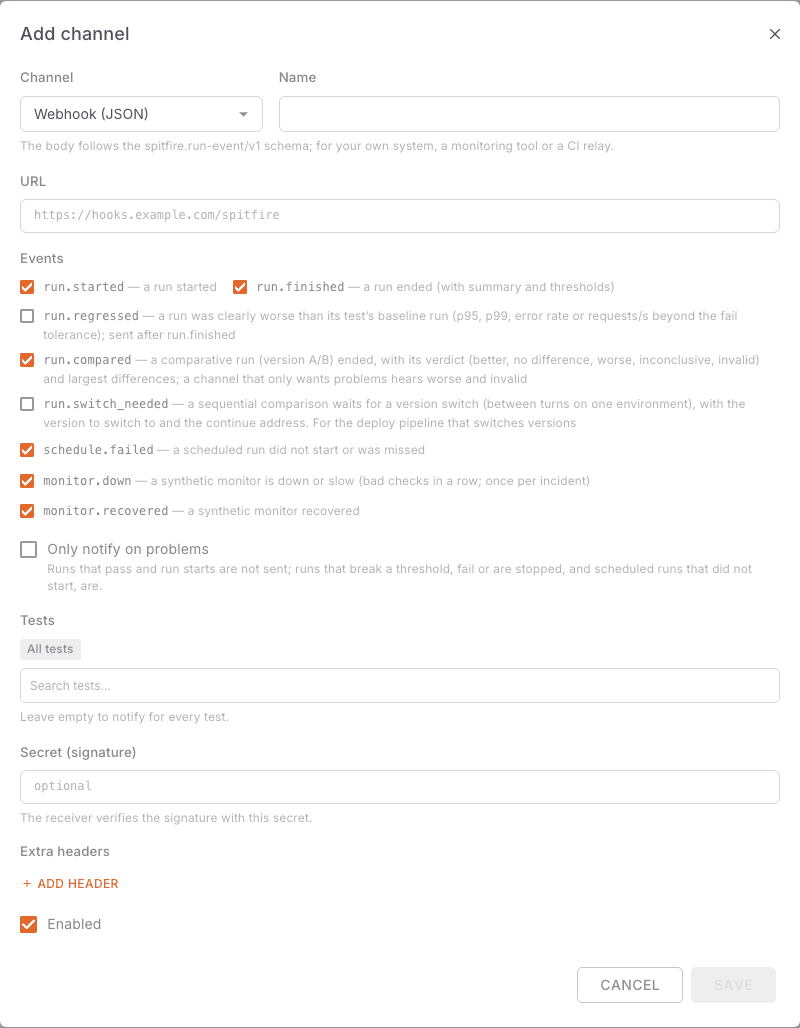 Add channel dialog
Failed deliveries are retried after 2 s, 15 s and 1 min. The Deliveries list shows each attempt's time, event, attempt number, result and run.
Slack
- In Slack create an Incoming Webhook (Apps → Incoming WebHooks) and pick the channel.
- Paste the address it gives (
https://hooks.slack.com/services/…) into Target in Spitfire. - The message carries the result, request count, p95, error rate, failed thresholds and a link to the run.
Microsoft Teams
- In the Teams channel create the Workflows → "Post to a channel when a webhook request is received" flow.
- Paste the flow's address into Target.
- The message arrives as an adaptive card.
E-mail channels send through your own SMTP server. Set SMTP up first:
- In the E-mail (SMTP) card fill in Server, Port, Security (STARTTLS (587), TLS (465) or None (trusted network only)), Username, Password and Sender. The password is stored encrypted.
- Press Save.
- Enter your own address as Test recipient and press Send a test e-mail. You should see "Sent.".
- Then create a channel with Add channel → E-mail; under Recipients put one address per line or comma-separated (at most 20).
E-mails about finished runs carry the run's PDF report; for a comparative run, the comparative PDF report.
With e-mail set up, Forgot password also sends a reset link by e-mail.
SMS (HTTP)
There are no provider presets: you describe the request your provider (or your own SMS gateway) expects, and Spitfire fills it in. It also works with your own gateway on a network closed off from the internet.
- Choose SMS (HTTP) as the Channel.
- Enter the Request URL (http/https) and pick the method (GET or POST). Placeholders may be used in the path and query, not in the host; redirects are not followed.
- Enter the Phone numbers in E.164 form (e.g.
+905321234567), one per line, at most 20. - Pick the Body type: None (values in the URL), Form (application/x-www-form-urlencoded), JSON or Raw text (with a Content-Type).
- Write the Body template. Placeholders:
{phone},{phones},{message},{message_url},{event},{test},{run_url},{secret}. - Do not write the API key into the URL or body: put it in Secret value ({secret}) and use
it as
{secret}in the template (e.g.Authorization: Bearer {secret}). Header values and the secret are stored encrypted. - One request for all recipients: off, each recipient gets its own request (
{phone}); on, the numbers are joined with commas and sent in one request ({phones}). - Success rule: HTTP 2xx counts as success. Many SMS APIs return an error with 200 in the body; if so, fill in Response must contain (optional) / Response must not contain (optional).
- At most notifications per hour (default 20) guards against floods and costs; each notification goes to every recipient.
- Turkish letters switch a message to UCS-2, where a part holds 70 characters. GSM-7 characters only (Turkish letters as ASCII) keeps a part at 160.
- Preview shows the request a sample message would make (nothing is sent).
- Save, then use Send a test SMS on the list to see the provider's answer.
Two examples (sms-gateway.example.com is a made-up gateway):
# Form POST, one request per recipient
POST https://sms-gateway.example.com/api/send
Body type: form-urlencoded
Body:      to={phone}&text={message}&sender=SPITFIRE&apikey={secret}
Response must contain: "status":"queued"

# JSON POST with an Authorization header, one request for all recipients
POST https://sms.example.com/v1/messages
Header:    Authorization: Bearer {secret}
Body type: JSON
Body:      {"recipients": "{phones}", "text": "{message}", "link": "{run_url}"}
A new SMS channel reports problems only by default (a failed threshold, a failed run, a
schedule that did not start, a monitor going down and recovering). Messages are short and plain,
e.g. Spitfire: 'Checkout flow' failed a threshold (p95 268 ms > 250 ms). https://spitfire.example.com/runs/…
Turn on Do not verify the TLS certificate only for an SMS gateway on your own network with a self-signed certificate.
Webhook (JSON)
For your own system, a monitoring tool or a CI relay. The body follows the
spitfire.run-event/v1 schema (target servers, the summary and thresholds at the end; for
run.compared the comparison's verdict and largest differences). Sample payload on the card
shows the schema.
- Choose Webhook (JSON) as the Channel and enter the Target address.
- Optionally enter a Secret (signature). Then the body's HMAC-SHA256 signature comes in the
X-Spitfire-Signature: sha256=<hex>header; the receiver verifies it with this secret. Every request also carriesX-Spitfire-EventandX-Spitfire-Delivery. - Add Extra headers if needed (e.g. your system's key). Header values are stored encrypted.
Live metrics with OTLP and Prometheus
The same page has two more cards:
- OpenTelemetry (OTLP): while a run is going, live metrics are sent over OTLP/HTTP (JSON) to a
collector (e.g. an OpenTelemetry Collector). Tick Send OTLP, enter the
Endpoint (base URL;
/v1/metricsis appended) and the Interval (s). Metrics carry labels such asspitfire.run.id,spitfire.test.name,server.address. - Prometheus: Prometheus can scrape
/metricswith a personal API token (spitfire_runners,spitfire_runs_active,spitfire_run_vus,spitfire_run_error_ratio,spitfire_run_latency_ms{quantile}…).
This is Spitfire exporting its own metrics. To bring your systems' metrics and traces into Spitfire, see Observability.
License notes
| Free | Growth yearly / Scale yearly | Enterprise | |
|---|---|---|---|
| Scheduled tests | 1 | unlimited | unlimited |
| Notification channels | 1 | unlimited | unlimited |
| Synthetic monitors | 1, at most every 15 minutes | 10 / 30 | unlimited |
Schedules, channels or monitors above the limit are not deleted; they are kept as Paused (license) and do not run (the oldest stay active).
Common problems
| Symptom | Cause | Fix |
|---|---|---|
| The schedule never ran, status missed | The controller was down or restarting at that time (more than 10 min late) | Missed runs are not made up; start one with Run now. See why the controller was down on System events. |
| Status skipped | The previous run was still going | Shorten the test or widen the cron interval. |
| Status did not start | No idle runner, license limit, writes not confirmed, or the owner lost access | Read the error on the row. For a test that changes data, tick the write confirmation in the schedule dialog. If the owner is disabled, recreate the schedule as another user. |
| "Invalid cron expression." | Not 5 fields, or wrong | Write minute hour day month weekday; check Next runs. |
| "Unknown time zone (e.g. Europe/Istanbul)." | Wrong zone name | Use an IANA name, e.g. Europe/Istanbul. |
| The monitor is always unknown | Checks are skipped: no idle runner | Runners busy in long runs cannot check. Set aside a runner/location for monitoring. |
| "The interval may be 1, 5, 15 or 60 minutes." | Invalid interval | Pick one of 1, 5, 15, 60 minutes. At most every 15 min on the free edition. |
| "The license makes this monitor check less often." | The license does not allow a shorter interval | Upgrade the license or lengthen the interval. |
| The monitor turned itself off | The test started writing, or its owner lost access | Save the monitor again with the write confirmation, or restore the access. |
| "The test cannot be monitored with these settings" | The test does not fit the monitor's light check | Read the detail in the dialog; simplify the test. |
| No notification arrives | Channel disabled, not subscribed to the event, Only notify on problems on, outside the test filter, or paused by the license | Check the channel's Events and Tests; try Send test; look at the result under Deliveries. |
| The link in the message does not open | Spitfire's public address empty or wrong | Save the right address in the General card. |
Slack/Teams answers 4xx |
The webhook was deleted or copied wrong | Create a new webhook in Slack/Teams and update Target. |
| E-mail does not go out | Wrong SMTP settings, port closed, or security type mismatch | Try Send a test e-mail; use STARTTLS for 587, TLS for 465. Errors show on System events with the Notification channels source. |
| SMS "succeeded" but nothing arrived | The provider returns the error with 200 in the body | Add a Response must contain / must not contain rule. Read the answer Send a test SMS shows. |
| SMS stop for an hour | The At most notifications per hour limit was reached | The delivery log says so; raise the limit or narrow to problems. |
| Phone numbers refused | Wrong number format | Use E.164, starting with +90…. |
Related pages
- CI/CD integration — running tests from a pipeline
- Version comparison — scheduled comparisons and
run.compared - Observability — reading your systems' traces and metrics
- Troubleshooting — notification channel errors, system events
- Scheduled runs
In Spitfire: /schedules· Synthetic monitoringIn Spitfire: /monitors· IntegrationsIn Spitfire: /integrations