Version: 0.21.0This documentation is for Spitfire 0.21.0.
Runs and results
Once a test is saved you run it: Spitfire sends the test to the selected runners, applies the load and shows the results second by second. This page covers starting a run, watching it live, stopping it, reading a finished run's results, comparing with past runs and the baseline, the HTML/PDF report and share links, and how long runs are kept.
What it is for
- The Run dialog lets you choose which runners or locations send the load, which environment the run targets and at what scale; the test itself does not change.
- The run page shows RPS, p95/p99 latency, error rate, checks, thresholds, a per-step table, failed request samples and Findings, live during the run and permanently after it.
- Baseline and Compare show whether a run got better or worse than earlier ones.
- The Report menu turns the run into an HTML/PDF report you can send to someone without an account, or into CSV.
When to use it
- When running a new or changed test for the first time.
- When comparing with the baseline after a release, to see whether performance regressed.
- When showing results to someone outside the team (a manager, a customer, a supplier).
Starting a run
A run is started from the test's page (Save in the editor does not start a run).
- Open the test from Tests.
- Click Run at the top right. The Run test dialog opens. (From the arrow next to the button you can also start a Comparative run and Calibrate (A/A).)
- Read the top of the dialog: "The load is split across the selected runners; total VU counts and arrival rates stay exactly as defined. N runners are idle right now." In the free edition the license limits are shown here too.
- Choose how runners are selected with one of four buttons:
- By count (default): as many idle runners as Number of runners are used. If on-demand runners can start in Kubernetes, the dialog says how many pods will start and suggests a number.
- By location: a Share (percentage) and number of Runners for each Location. The total must be 100% ("Total 100%"); Spread evenly evens out the shares. The last split is remembered on the test.
- By labels: runners carrying the labels you type in the Labels field, such as
zone=a,region=eu. - Pick: choosing runners one by one from a list.
- If the test changes data, a red box appears ("This test modifies data…") and you must tick I understand this test changes real data; start it to start. With the mobile app set up, Or confirm on my phone lets you confirm on your phone (with a biometric check).
- In the Environment and scale section ("The test does not change; these apply to this
run only and are shown on it."):
- Environment: As in the test, or an environment defined on the test's Environments tab.
- Load scale: a percentage. "VUs, rates and stage targets are multiplied by N%." Between 1% and 10000%. Starting a first run at 10–25% is a good habit.
- Change variables for this run: when expanded, lists the test's variables; you can give values for this run only. "An empty variable keeps its value from the environment (or the test)."
- To measure capacity, tick Find the breaking point (capacity test) (see Finding the breaking point).
- Optionally type a note in Note (optional) (e.g. "v2.3 release, cache on"). The note shows in the run list and in comparisons.
- Click Start. The run page opens.
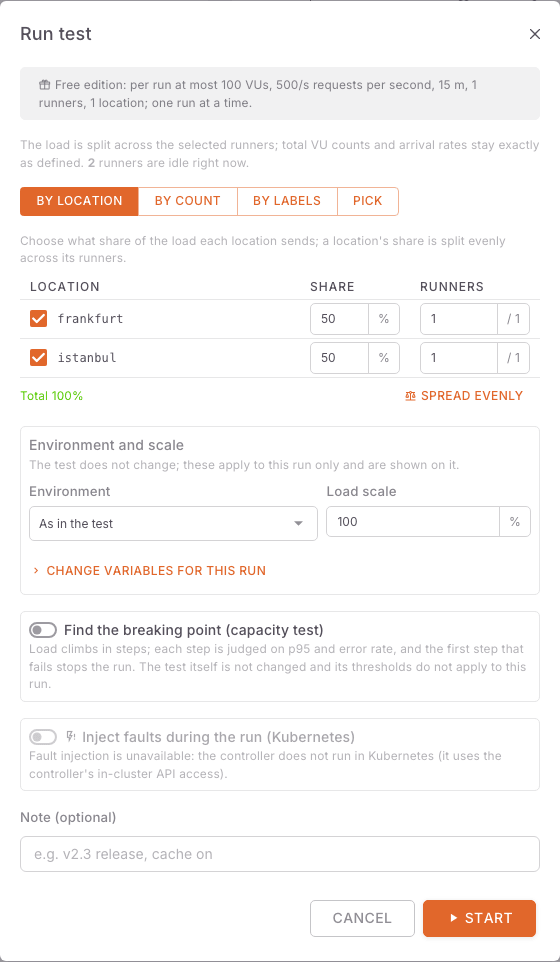 Run test dialog
 Environment and scale: changing variables for one run
A run with a changed environment, scale or variables gets a badge in its header
listing those differences (e.g. staging · 50% · user=ci); what a run used is always
recorded.
If the run cannot start, the dialog says why:
| Message | What to do |
|---|---|
| "Not enough idle runners. Connect a runner or wait for the current run to finish." | Check on the Runners page that runners are connected and idle. |
| "This run needs 150 concurrent VUs; the free edition allows up to 100." (or requests/s, duration, runners, locations) | Lower Load scale or make the test smaller; see License limits. |
| "Another run cannot start now: … allows 1 run at a time and it is active…" | Wait for the active run to end, or stop it. |
| "This test modifies data; confirm to continue." | Tick the confirmation box from step 5. |
| "A connection used by the test is not available." | Try the connection the step uses with Test on the Connections page. |
Watching live
When the run page opens, a blinking live marker shows next to the title. The progress bar at the top shows the run's phases:
- Prepare: "Sending the scenario to N runners, preparing connections…"
- Countdown: "All runners ready, starting together in" and a seconds counter.
- Applying load: the time left, each scenario's current target ("target 50 VUs", "target 100 iter/s") and the direction of the load (Load increasing, Load decreasing, Load steady).
- Results: "Test finished, saving results…"
The browser tab's title shows the progress percentage too, so you can follow it while working in another tab.
Below it are tiles and charts updated every second during the run:
| Tile | What it shows | Color |
|---|---|---|
| Requests/s (now) (Average RPS after the run) | RPS in the last second; total requests under it | — |
| p95 latency | p95 latency since the start of the run; p99 under it | Green/yellow/red against the response time threshold |
| Error rate | Share of failed requests; the failed count under it | 0% green, under 1% yellow, above red |
| Checks | Share of passed checks | 100% green, above 99% yellow, below red |
| VU | Current VUs; the maximum under it | — |
| Iterations | Total iterations; "none dropped" or a red "N dropped" under it | Red when iterations were dropped |
Charts: Request rate (req/s), Active virtual users, Response time (p50, p90, p95 and p99 lines; a dashed threshold line when there is a response time threshold) and Error rate. Each chart can switch between Chart view and Table view.
 Live run: progress, tiles and charts
If the live stream drops it says "Live stream lost, reconnecting…"; the run goes on on the runners and the page reconnects by itself.
Stopping a run
While a run is going, the header has two buttons:
- Stop: "No new iterations start; iterations in progress finish within the gracefulStop period." Use this normally; the results are saved complete.
- Kill now: "In-flight requests are cancelled. Data for the last second may be incomplete." When the target system is being harmed and there is no time to wait.
Step by step:
- Click Stop.
- In the Stop run dialog, click Stop again.
- The progress bar says "Stopping: in-flight iterations are finishing…"; the run ends within a few seconds up to the Graceful stop time.
A run can also stop by itself: when a threshold with Stop when crossed is crossed (the threshold shows "stopped the run") or when a runner drops (if the test's When a runner is lost setting is Stop the run). The reason is shown in a box at the top of the page.
Run statuses:
| Status | Meaning |
|---|---|
| Queued, Preparing | Runners are being assigned and prepared |
| Running | Load is being applied |
| Stopping | A stop was requested; iterations are finishing |
| Finished | It ran to the end of the plan |
| Aborted | A user or a threshold stopped it |
| Failed | The run broke off because of an error |
| Interrupted | The controller restarted while the run was going; the run was cut short |
The run's result is shown separately as Passed, Thresholds failed or Error.
Reading results
A finished run's page shows the same tiles and charts for the whole run, with detail cards below. A suggested reading order:
- The boxes at the top: the red "N thresholds failed:" box lists which thresholds failed
(e.g.
req_duration {step: Create order} p(95)<800). If the run stopped for a reason, it is shown here too. - The tiles: p95, error rate, and the "N dropped" warning on the Iterations tile. When iterations were dropped, the load did not reach its target; read the other numbers with that in mind.
- The Findings card: points drawn from the run's own numbers that say where to look (below).
- The charts: when did p95 rise? What were the VUs or RPS at that moment?
- The Steps table: which step is slow or failing?
- The Checks and Thresholds cards.
- Failed request samples: the error itself (status, response body).
- Runners and Event log: what happened during the run?
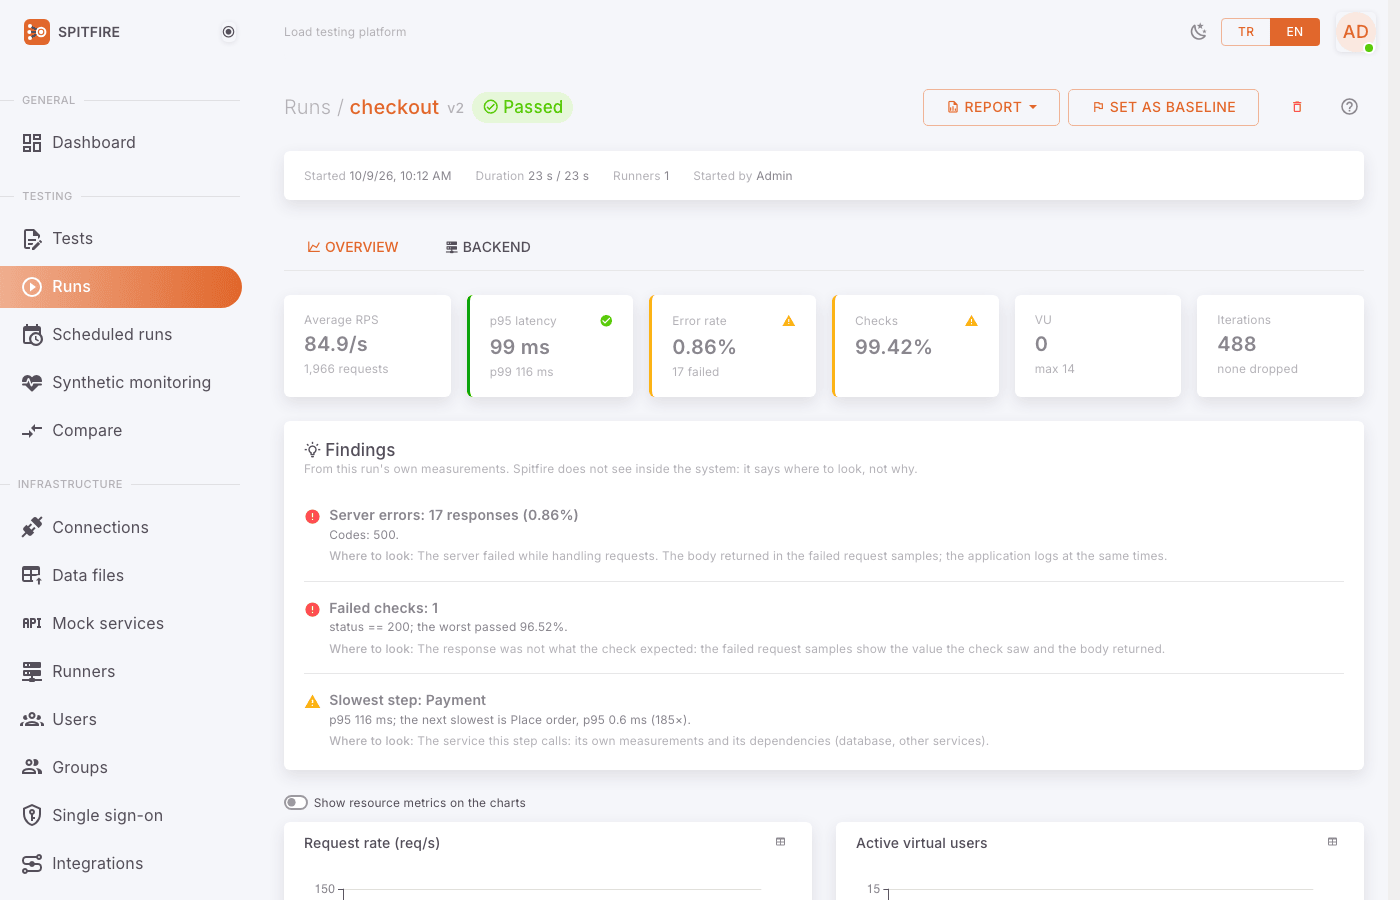 A finished run's page
p95 or average
p95 and p99 show the latency users experience: p95 = 500 ms means 95% of requests
were answered in 500 ms or less and 5% took longer. The average (avg) hides a few very
slow requests among thousands of fast ones; the average can be 120 ms while p99 is 3
seconds. Base your decisions on p95/p99; a large gap between p99 and p95 is a sign of "a long
latency tail".
Steps table
The Steps card has one row per step: Scenario, Step, Requests, RPS, avg, p50, p95, p99, max and Errors (percentage).
- Red row with a cross icon: "Threshold failed or errors ≥ 5%".
- Yellow row with a warning icon: "Some requests failed".
- Find the slowest step in the p95 column; Findings also states it separately.
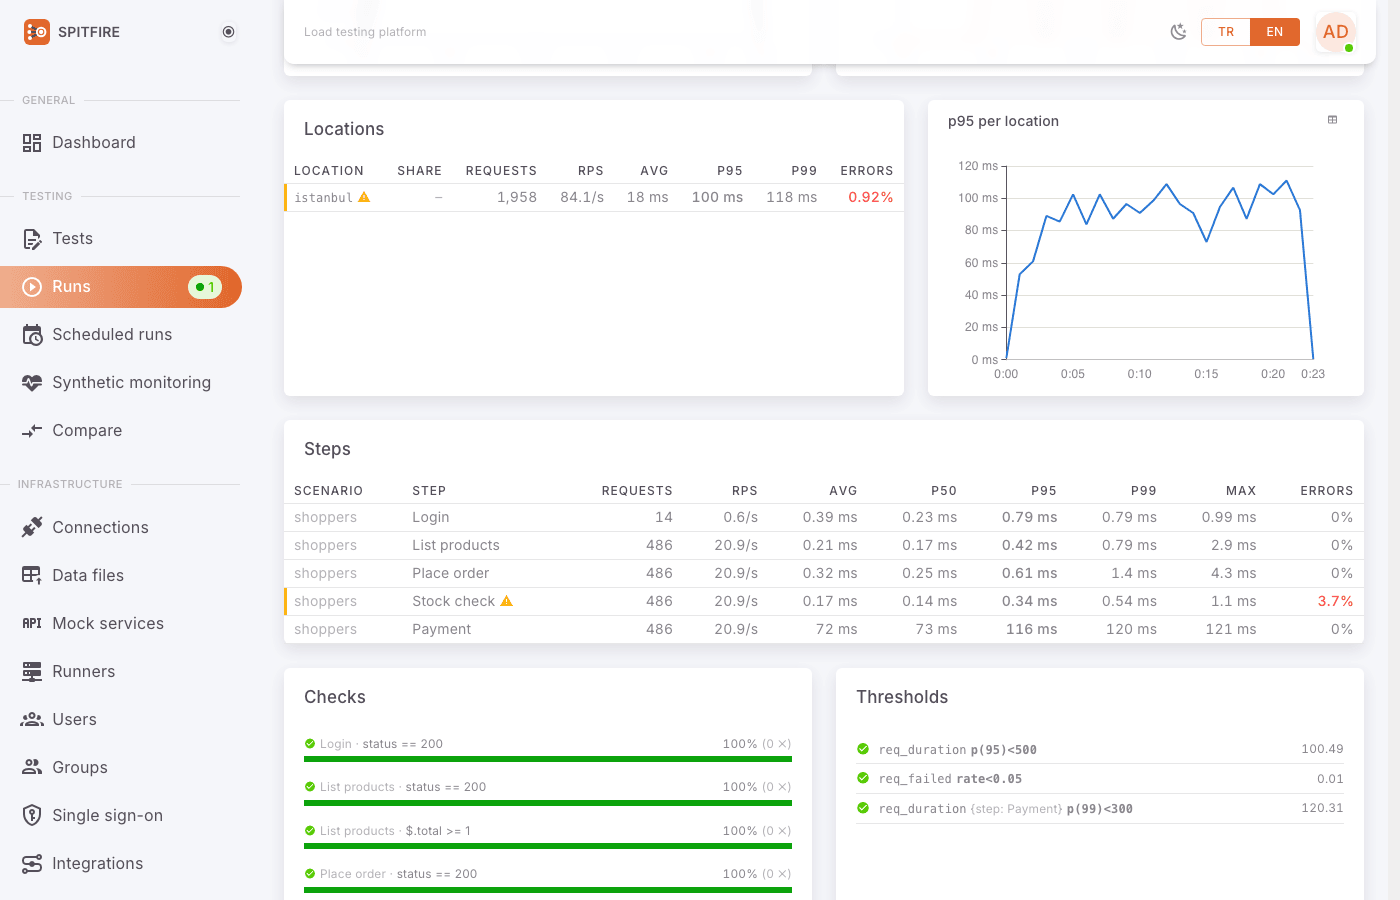 Steps table
Findings
The Findings card appears only after the run has finished: "From this run's own measurements. Spitfire does not see inside the system: it says where to look, not why." Example points: the slowest step and its ratio to the next one; error kinds (5xx, 429 rate limit, other 4xx, timeouts, refused connections, DNS/TLS); the saturation point where RPS did not grow although load did; iterations that could not start; a location difference; failed checks; a regression against the baseline. Each point comes with its numbers and a "Where to look:" suggestion. With nothing notable: "Nothing stands out: the numbers are within the limits."
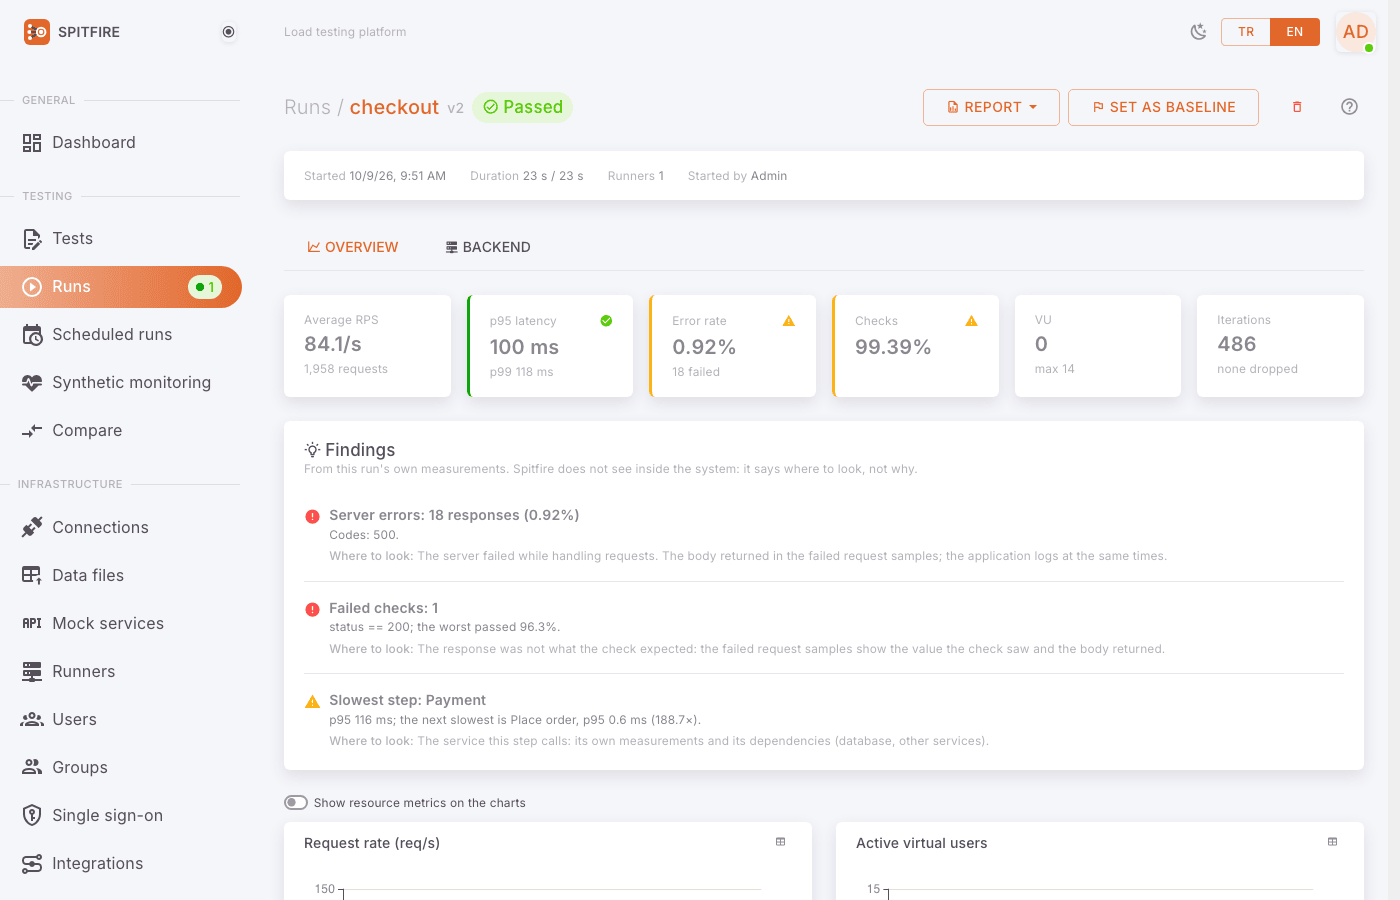 Findings card
Error breakdown and failed request samples
To break the error rate down:
- The Errors column of the Steps table shows which step fails.
- Findings separates the error kinds: server errors (5xx, with their codes), rate limit (429), client errors (4xx: authorization, missing record, missing field), timeouts, refused/closed connections, DNS or TLS errors.
- The Failed request samples card keeps a few failed requests ("at most 3 per step and outcome; the first 2 KB of the response body"): the target address, the status or error, Failed checks, Response headers and Response body. A "500" thus comes with what the server said. This can be turned off in the test (Options → Failed request samples → Off).
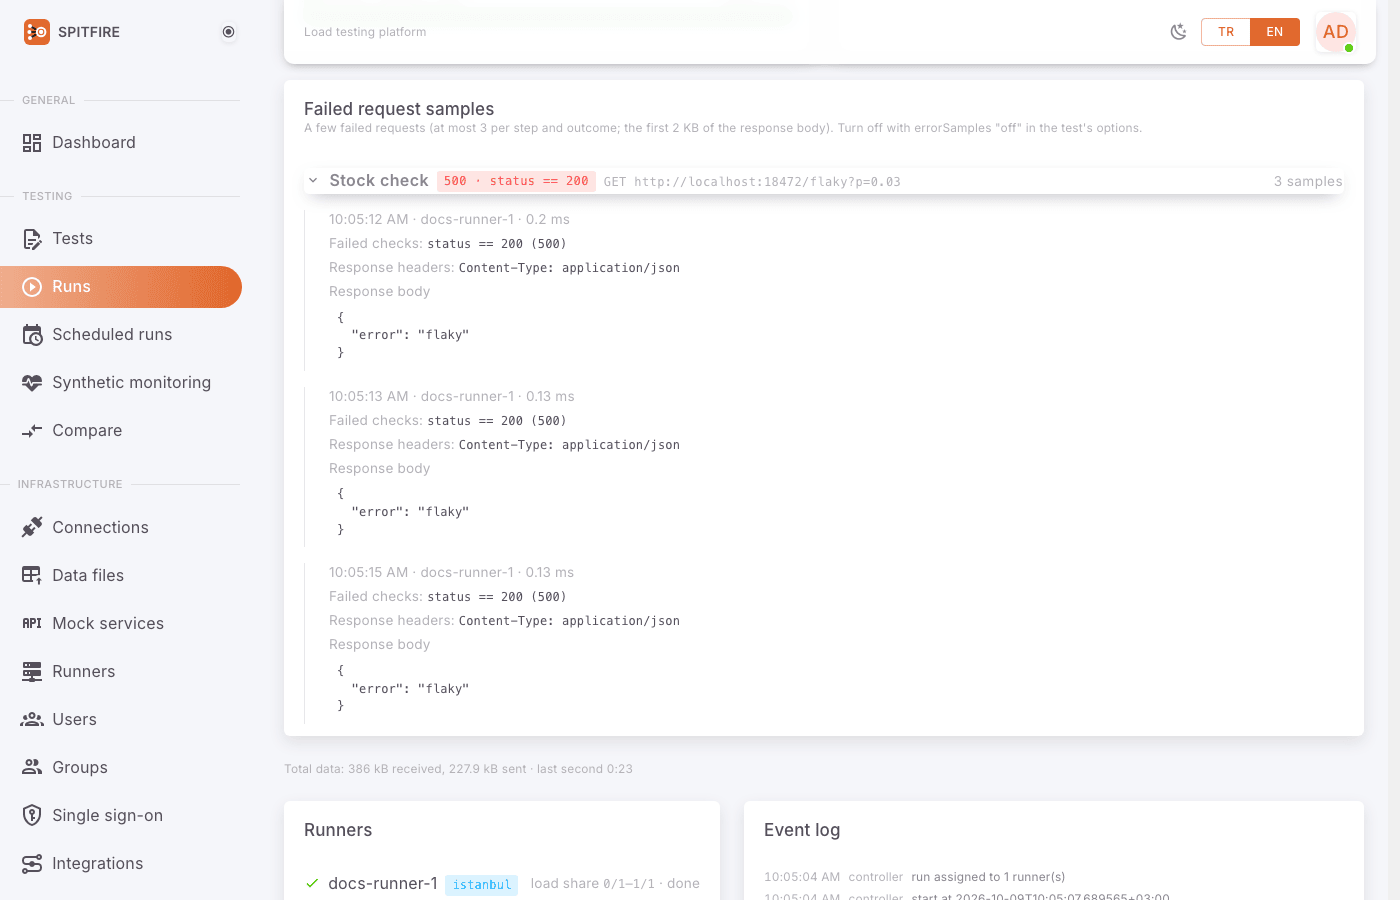 Failed request samples card
By default a step "fails" on HTTP 400 and above, timeouts and connection errors.
When the step has a status check (e.g. one expecting 404), those codes do not count as
errors. Failed checks count in the Checks rate, not in the error rate.
Timeline
The charts' horizontal axis is the run's seconds. To tie a problem to time:
- Find the moment p95 rises on the Response time chart.
- Look at Active virtual users and Request rate (req/s) at the same moment: if VUs grow while RPS does not and p95 rises, the system is saturated.
- On the Error rate chart, see whether errors start at the same moment.
- With an observability connection, add the system's resource series such as CPU to the same charts with Show resource metrics on the charts (dashed line, right axis), or switch to the Backend tab.
- The Event log card lists the events of the run (runner connections, stop…) with their times.
Per-location results
When a run came from several locations, the Locations card shows Share, Requests, RPS, avg, p95, p99 and Errors per location; the p95 per location chart next to it compares the locations over time. When one location is clearly slower than the others, the problem is most likely in the network between that location and the target. A threshold can be defined per location (see Scope and filters).
Check and threshold cards
- Checks: for each check, the step name, the check name, the pass percentage and the failed count ("(12 ✗)").
- Thresholds: each threshold's metric, filter, expression, measured value and result. An "aborts" badge when Stop when crossed is set, "stopped the run" if it did; "no data" when there was nothing to measure.
 Thresholds card on the run page
In the note field at the bottom of the page ("Note about this run") you can write a remark about the run and click Save.
Comparing with past runs
Setting a baseline
The baseline is a test's "known good" reference run. Comparisons and findings are made against it.
- Open the page of the finished run you want as the reference.
- Click Set as baseline in the header. A baseline badge appears in the header and the test page shows "Baseline: go to run".
- To remove it, use Remove baseline in the same place.
Baseline runs are never deleted by the data retention settings.
Comparing with the baseline
- On the new run's page, click Compare with baseline (shown when the test has a baseline and this run is not it).
- The Comparison page opens: the runs table, p95, request rate, error rate and active VU charts overlaid, and the Metrics table below.
- The colors follow the test's Comparison tolerance (editor → General & variables; defaults Warning (%) 5, Regression (%) 15): a change up to 5% against the baseline is good, up to 15% a warning, anything above a regression. Rates (errors, checks) are judged in percentage points; duration differences under 1 ms count as noise.
- Switch the scope with Overall / Steps; Issues only shows only warning and regression rows.
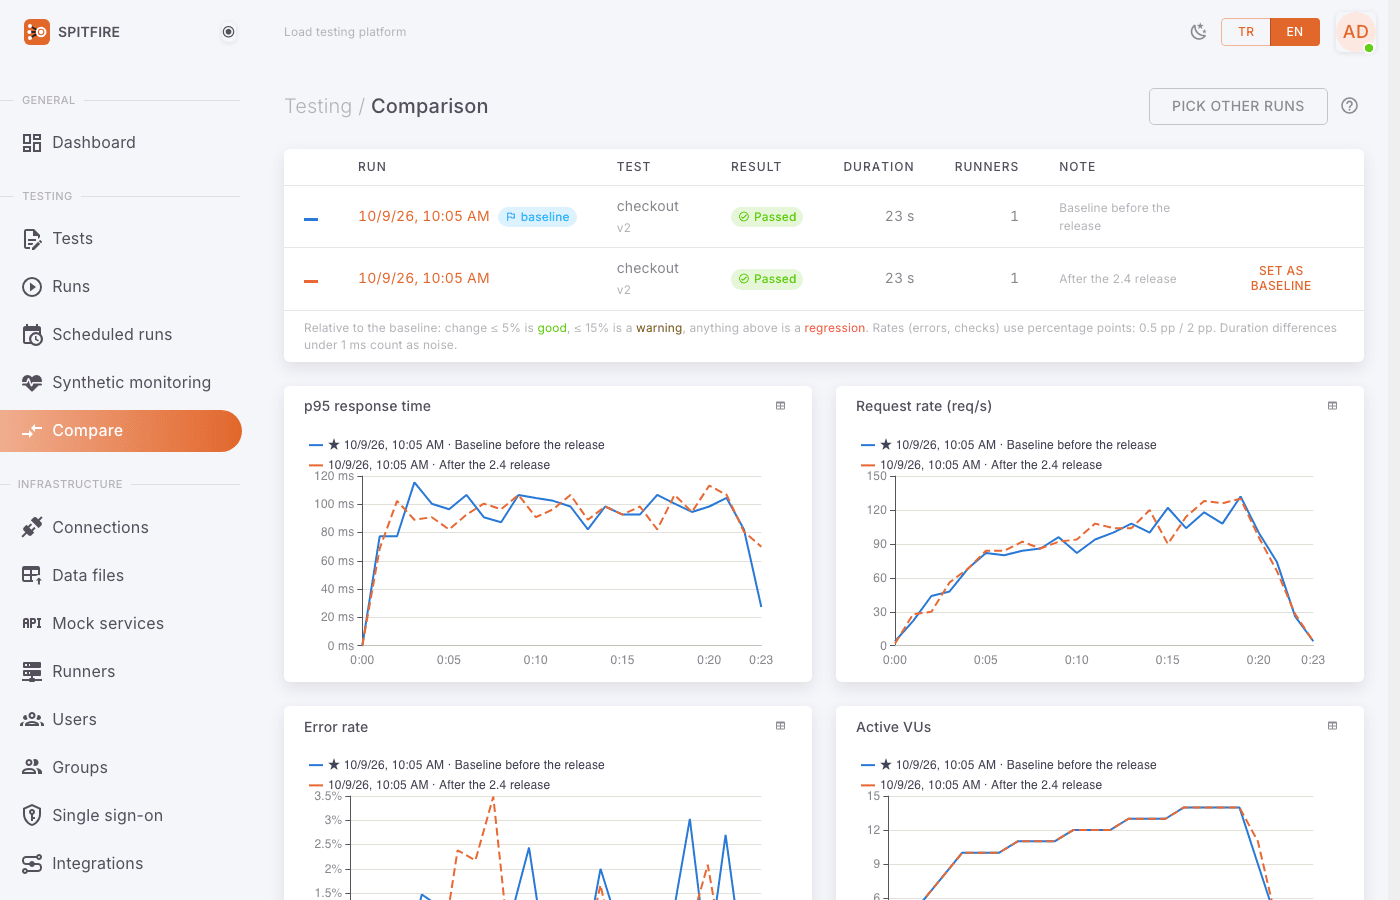 Comparison page
If the warning "The runs have different test definitions (the version or load profile changed)." appears, differences may also come from the test having changed. To compare like with like, use the same test version, the same load profile and the same environment.
Comparing several runs
- From the test page: tick the runs to compare in the runs table and click Compare selected.
- From the Runs page: select runs with Add to comparison on their rows and click Compare (N) at the top. "The first one you select becomes the baseline."
- From the Compare menu: pick a test and tick 2–6 runs.
The p95 trend (recent runs) and Error rate trend charts on the test page show the recent runs' direction at a glance.
Runs page
Runs in the left menu lists the runs of all tests: Started, Test, Duration, Requests, Errors, Checks, Note and status. The buttons at the top filter Running, Finished, Aborted or Failed runs. Clicking a row opens the run page.
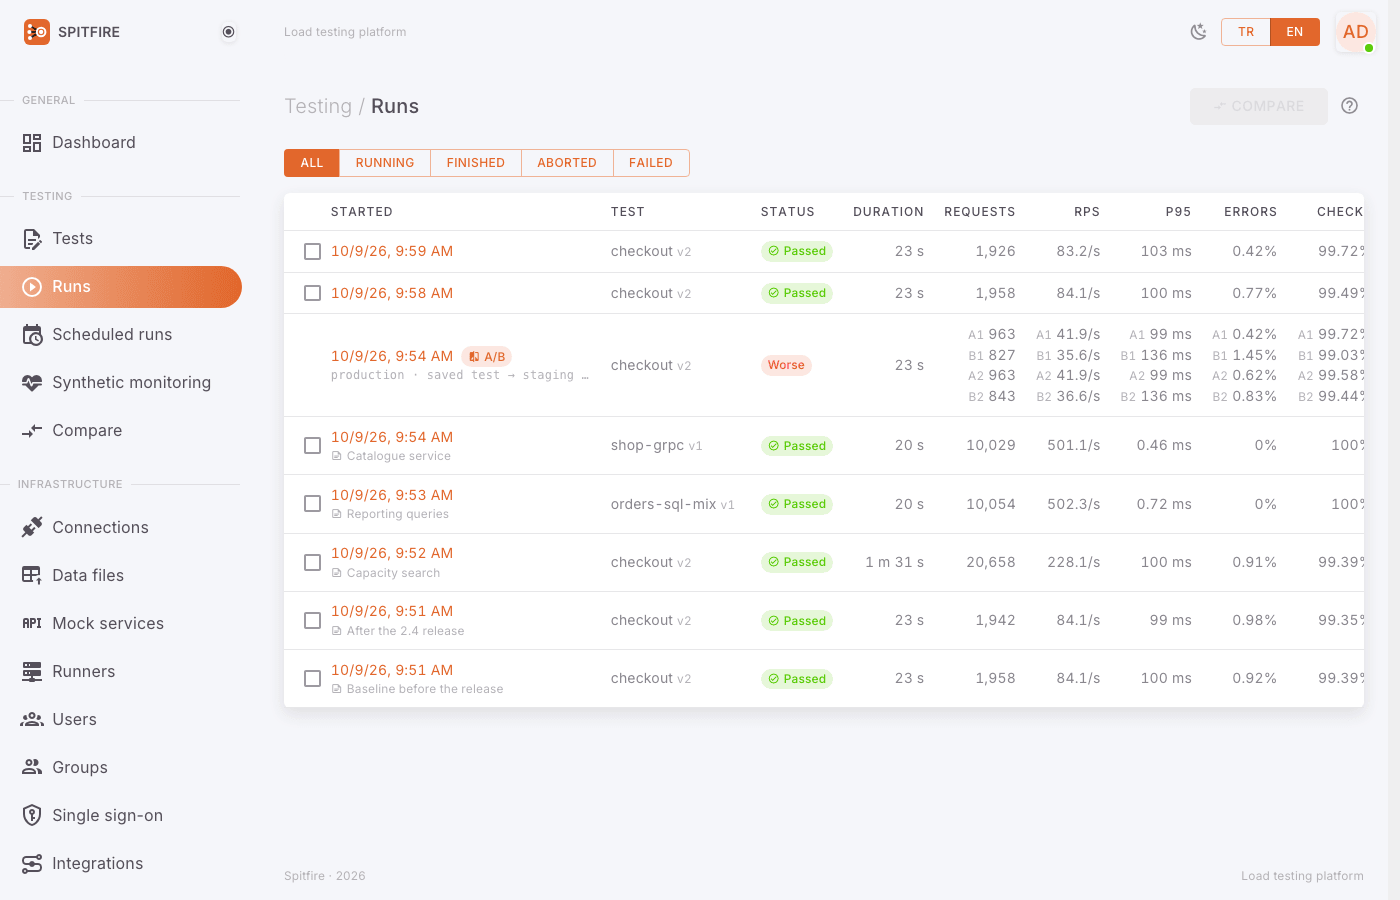 Runs page
Reports and share links
The Report menu on the run page:
| Option | What it gives |
|---|---|
| HTML report (new tab) | A self-contained HTML page: charts, thresholds, steps, locations, status codes, checks and the change against the baseline |
| Download PDF | The same report as PDF |
| CSV — summary (steps, locations) | Step and location summaries, as a table |
| CSV — per second | Every second of the run |
| Share link… | A share link to show the report to someone without an account |
The report can be produced in Turkish or English.
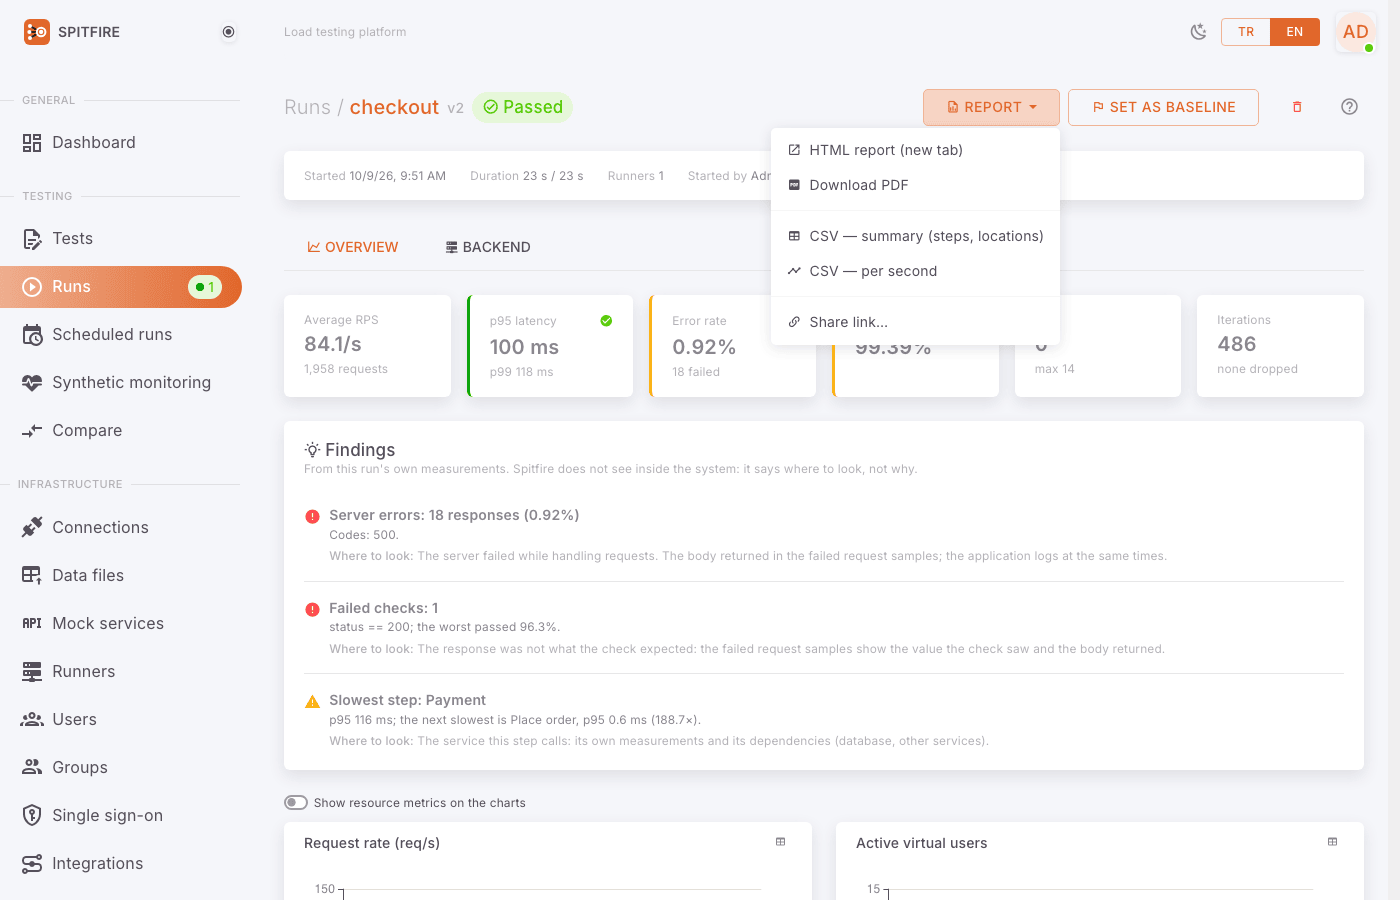 Report menu
Creating a share link:
- Click Report → Share link…. The Share the report dialog opens: "Anyone with the link sees this run's report (HTML and PDF) without signing in, until it expires or is revoked. Every view is written to the audit log."
- Valid for: 1, 7, 30 or 90 days.
- Language: the report's language.
- Click Create link.
- "The link is shown only now; copy it." Copy the link right away; it is not shown again after the dialog closes (create a new one if needed).
- The Links list shows each link's Created, Created by, Expires and Views. To cut off access, click Revoke.
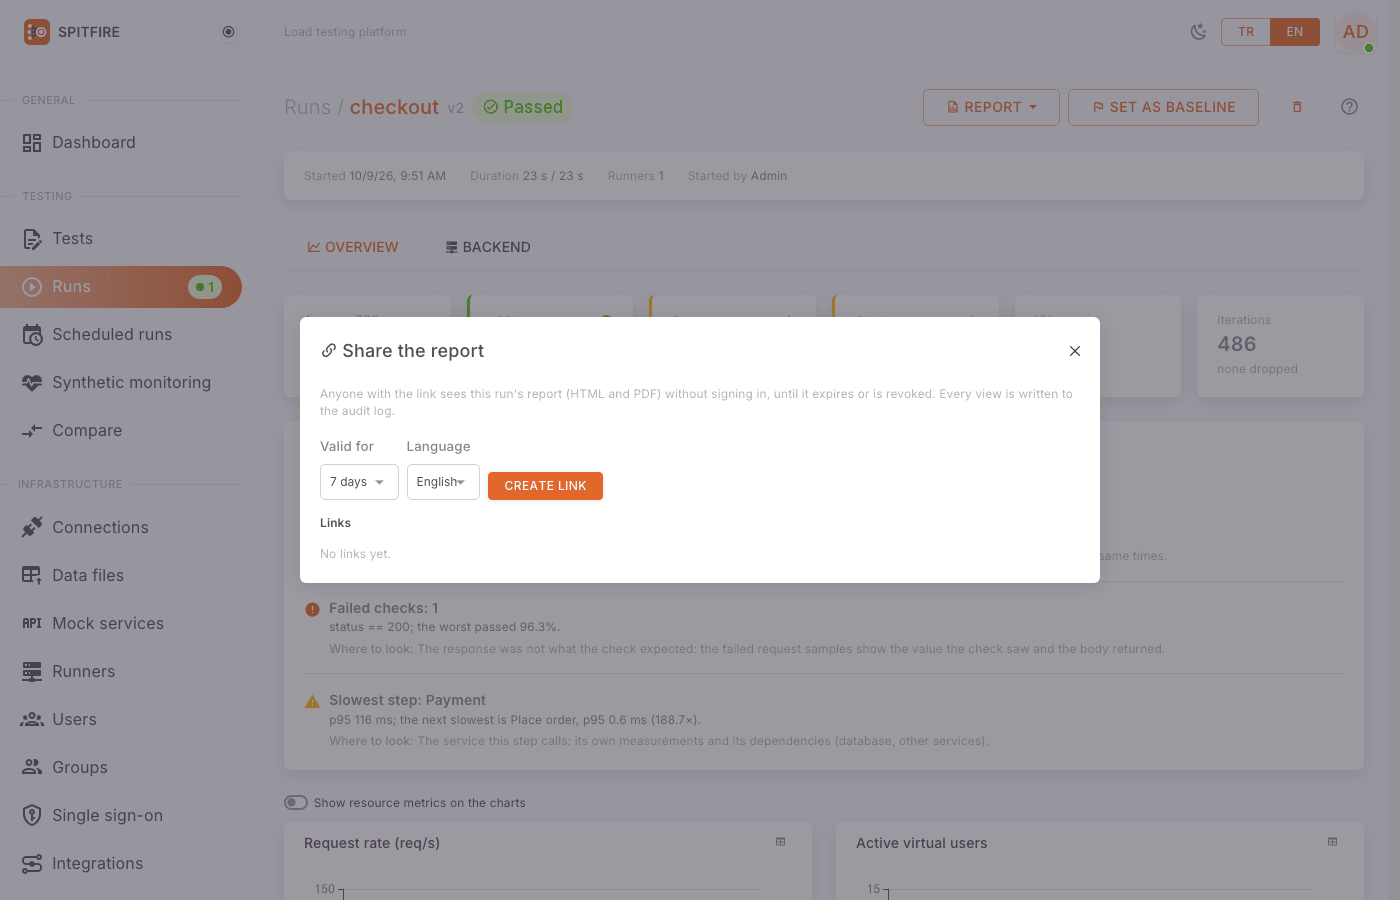 Share the report dialog
A report can be shared once the run has ended ("A report can be shared once the run has ended."). Creating a share link requires being an admin or having the right to run the test. On installations without a paid license, PDFs and shared reports carry a "Made with Spitfire Free" line at the bottom.
Running again
There is no separate "run again" button; to run the same test again:
- Click the test name in the run page's header, or go to the test from Tests.
- Click Run. The last split in By location mode is remembered; choose the environment, scale and variables again.
- To compare with the previous run, make the previous run the baseline, or open both runs with Compare.
For regular repeats use Schedule on the test page (scheduled runs); to run from a pipeline use the CI button (Run in CI); in CI a failed threshold gives exit code 99.
Run retention
Run data is kept in two layers:
- Per-second data and logs: the charts' per-second points, run logs and failed request samples. They are deleted when their time is up; the run's summary (tiles, step table, threshold results) remains. 7 days in the free edition; 90 days by installation default; the license may keep it shorter.
- Runs: finished runs past their retention are deleted with their summaries, reports and share links. Left empty (0), runs are kept forever.
An admin sets these periods in the Data retention card on the License page. "Old data is deleted once a day. Tests' baseline runs and runs in progress are never deleted." Before saving, it shows how many runs would be deleted.
To delete a run by hand, use the trash icon on the run page: "All metrics of this run will be permanently deleted."
Common problems
| Symptom | Cause | Fix |
|---|---|---|
| Start is disabled | No idle runners, the total is not 100% in By location mode, or no runner is picked in Pick mode. | Check the runners; make the shares 100% (Spread evenly); pick at least one runner. |
| Start is disabled, with a red data box | A test that changes data has not been confirmed. | Tick I understand this test changes real data; start it. |
| The run stays in Prepare for a long time | Runners cannot set up connections, or Kubernetes pods are starting (20–60 s). | Look at the statuses in the Runners card ("prepared", "failed", "lost") and at the Event log. |
| "N dropped" on the Iterations tile | No free VU was left in an open model. | Raise Max VUs; see Load model. |
| High error rate, 4xx in Findings | The requests are wrong: token expiry, test data, missing fields. | Read the body in Failed request samples; check the test with Try it. |
| High error rate, 429 | The target's rate limit. | Exempt the test addresses from the rate limit, or size the load accordingly. |
| p95 is fine but the run "Thresholds failed" | Another threshold (error rate, checks, a step filter) failed, or "no data". | See which threshold failed in the red box at the top and on the Thresholds card. |
| "different test definitions" warning in a comparison | The runs used different test versions or load profiles. | Run again with the same version, or take it into account when reading the differences. |
| Compare with baseline is not shown | The test has no baseline, or the open run is the baseline. | Mark a run with Set as baseline. |
| An old run's charts are empty but its summary is there | The per-second data retention expired. | Lengthen it in License → Data retention; make important runs the baseline, or keep their report as PDF. |
| A share link does not open | It expired or was revoked. | Check its status ("expired", "revoked") in the Share the report dialog and create a new link. |
Related pages
- Test editor: changing the test, a single iteration with Try it.
- Load model: load models, thresholds, the breaking point.
- Test data: per-run variables and data files.
- Runs
In Spitfire: /runs· CompareIn Spitfire: /compare· TestsIn Spitfire: /tests