Version: 0.21.0This documentation is for Spitfire 0.21.0.
Kafka
What it does
A Kafka step produces records to a topic or consumes records from a topic. The produce step measures the broker's acknowledgement (ack) time, the consume step the time spent waiting for a record. Two extra measurements show what the load does to your pipeline:
- End-to-end latency (
kafka_e2e_latency): the time from producing a record to consuming it. - Consumer lag (
kafka_consumer_lag): how far a consumer group is behind (in records). You can watch your own steps' group or your real service's group.
When to use it
- To measure how fast a service can write to Kafka (records per second, ack time).
- To see whether your consumer service falls behind (lag) under load.
- To follow the total latency between produce and consume.
Creating the connection
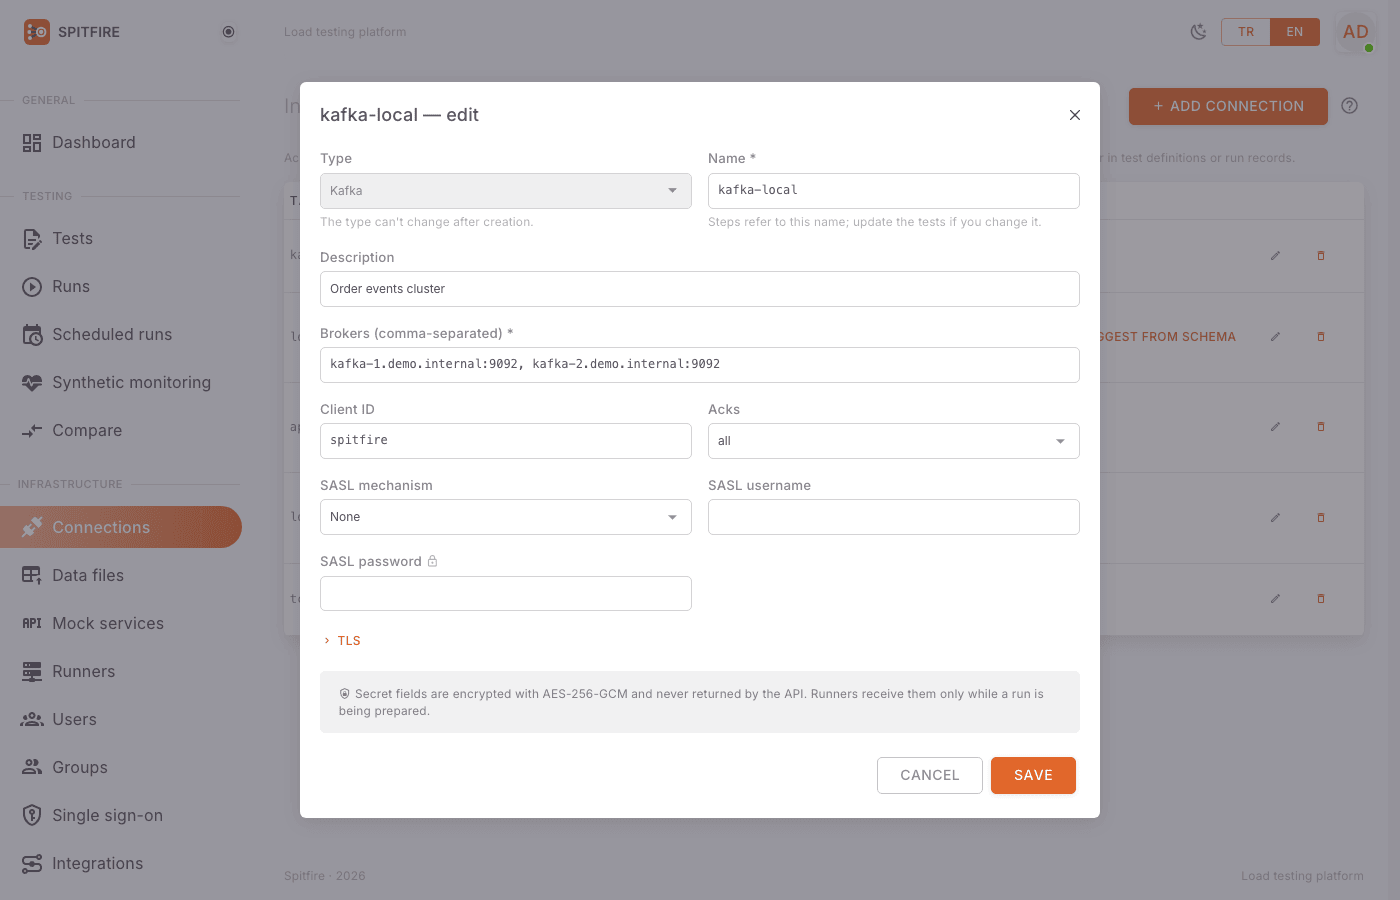 Kafka connection
- Connections → Add connection, Type: Kafka.
- Give it a Name (e.g.
kafka-local). - Brokers (comma-separated): at least one broker, for example
kafka-1:9092, kafka-2:9092. Required. - Client ID (optional, e.g.
spitfire): appears in broker logs and quotas. - Acks:
all(default, all replicas),leaderornone. The produce time is measured with this setting; choose what your production uses. - If authentication is required, fill SASL mechanism (
PLAIN,SCRAM-SHA-256,SCRAM-SHA-512), SASL username and SASL password (a secret). - If the brokers use TLS, expand TLS and tick Use TLS; add a CA certificate for a private CA.
- Save and Test.
Produce step
- Add step → Protocol: Kafka → Connection:
kafka-local. - Action: Produce.
- Type the Topic.
- Write the Key (the same key goes to the same partition) and the Value. Both may use
{{variables}}. - Add Headers if needed.
- Stamp records (spitfire-ts) for end-to-end latency is on by default; a
spitfire-tsheader is added to every record. Turn it off if the target system rejects unknown headers ("noStamp": true). A header of your own with the same name is left alone. - To watch your real service's lag, write group names, comma-separated, in Lag of other consumer groups (e.g.
order-service; at most 10).
 Kafka produce and consume steps
Consume step
- Action: Consume.
- Type the Topic.
- Consumer group:
- Empty: each VU reads the topic on its own from the latest record.
- Set (e.g.
spitfire-load): the VUs share the partitions, like a real consumer group.
- Wait (default 10s): if no record arrives in that time, the step fails with
no record on <topic> within 10s. - Watch this consumer group's lag: available once you set a fixed consumer group, ticked by default (
"noLag": trueturns it off).
[
  {"id": "send", "name": "Send order", "protocol": "kafka", "connection": "kafka-local",
   "kafka": {"action": "produce", "topic": "orders", "key": "{{__VU}}",
     "value": "{\"id\": \"{{$uuid}}\"}", "lagGroups": ["order-service"]}},
  {"id": "read", "name": "Read order", "protocol": "kafka", "connection": "kafka-local",
   "kafka": {"action": "consume", "topic": "orders", "groupId": "spitfire-load", "wait": "10s"}}
]How end-to-end latency is measured
- The produce step adds a
spitfire-tsheader to every record (<unix ns>;<source>). - When a consume step reads a record stamped in the same run on the same runner, it records the time from sending to reading as
kafka_e2e_latency. - Records produced by other tools, other runs or other runners are consumed normally but not measured.
Why the same runner? Runners' clocks can differ by more than the latency being measured. Spitfire never compares two machines' clocks; when the runner that produced a record also consumes it, both ends read the same monotonic clock. In a run spread over N runners about 1/N of the records are measured; the run page says so: N runners: records produced on another runner are not measured, so this is a sample of the traffic.
How consumer lag is measured
- Lag = the partition's end offset − the group's committed offset. On a partition with no commit, every record it holds counts.
- One runner per run (the one with the first share of the load) queries the Kafka admin API every 2 seconds.
- The query is read-only: it lists offsets; it never joins the group, never commits, never resets offsets.
kafka_consumer_lagis the total per group;kafka_consumer_lag_partitionis per partition (labelledgroup/partition; at most 64 partition series per group).- Topic and consumer group must be fixed names, not templates (
{{…}}); with a template the lag is not watched and the editor warns.
Permissions needed: the connection's user needs Describe on the topic (metadata, ListOffsets) and Describe on every watched consumer group (OffsetFetch). Without them the run continues and a warning is written; only the lag is not reported.
Metrics and thresholds
| Metric | Meaning |
|---|---|
req_duration |
Produce: broker ack time. Consume: time waiting for the record |
req_failed |
Rate of failed produce / consume calls (timeouts included) |
kafka_e2e_latency |
End-to-end latency (ms), p50/p95/p99 |
kafka_consumer_lag |
Lag per group (records) |
kafka_consumer_lag_partition |
Lag per partition |
The Kafka card on the run page shows the End-to-end latency (produce → consume) and Consumer lag (records) charts, and each group's lag At the end and its Peak.
Threshold examples:
[
  {"metric": "kafka_e2e_latency", "expr": "p(95)<500"},
  {"metric": "kafka_consumer_lag", "expr": "max<10000"},
  {"metric": "kafka_consumer_lag", "filter": {"check": "order-service"}, "expr": "value<100"}
]max<10000: no watched group fell further behind than that. value<100: less than 100 records of lag left when the run ended. filter.check picks a single group.
Common problems
Symptom: Test fails with dial tcp …: connection refused or a timeout.
Cause: Wrong broker address, or the address the broker advertises (advertised.listeners) does not resolve from the controller.
Fix: Make sure the host names the brokers advertise resolve and are reachable from the controller and the runners.
Symptom: SASL authentication failed.
Cause: Wrong mechanism, username or password.
Fix: Make SASL mechanism match the broker; type the password again and save. SASL is usually combined with TLS: check Use TLS.
Symptom: TOPIC_AUTHORIZATION_FAILED or GROUP_AUTHORIZATION_FAILED.
Cause: The user may not write/read the topic or access the group.
Fix: Grant the needed Write/Read/Describe rights in the Kafka ACLs.
Symptom: The consume step keeps failing with no record on orders within 10s.
Cause: No new records arrive on the topic; a consume without a group starts at the latest record and does not read older ones.
Fix: Add a produce step to the same test or run the system that writes to the topic; raise the Wait.
Symptom: End-to-end latency is empty or has very few samples. Cause: Produce and consume run on different runners, the stamp is off, or another system produces the records. Fix: Keep the stamp on in the produce step; put the produce and consume steps in the same scenario. Remember the sample shrinks in runs with many runners.
Symptom: The editor warns consumer lag is not watched: the topic or consumer group is a template.
Cause: The topic or consumer group contains {{…}}.
Fix: Use fixed names on steps whose lag you want to watch.
Symptom: The run goes on but there is no lag chart; the run shows a permission warning. Cause: The connection's user has no Describe right on the topic or the group. Fix: Grant Describe on the topic and on every watched group.