Version: 0.21.0This documentation is for Spitfire 0.21.0.
SQL
What it does
A SQL step runs a query on a database and measures its time. Supported databases: PostgreSQL, MySQL / MariaDB, SQL Server and Oracle. A step works in one of two ways:
- Single query: the same query on every iteration (its parameters may change).
- Query mix: on every iteration one of several queries, picked at random by weight. One step then reproduces the production query profile; results show each query's latency and errors on their own.
You can write queries by hand, bulk add them from a .sql file, import them from production statistics (pg_stat_statements, MySQL digests), or have them suggested from the database schema (SQL: query suggestions from the schema).
For data safety every query goes through a write guard: anything that is not a read needs an explicit approval, and on PostgreSQL and MySQL reads also run inside a read-only transaction (see Write protection).
When to use it
- To see which query slows the database down under load.
- To measure the before/after effect of an index, a version upgrade or a parameter change.
- To test the database layer alone, without bringing up the application.
The load test runs the query on the real database on every iteration. Use a test/staging copy instead of production, and a least-privilege, read-only database user.
Supported databases
| Type | Default port | Parameters (placeholders) | Reads in a read-only transaction |
|---|---|---|---|
| PostgreSQL | 5432 | $1, $2… |
Yes |
| MySQL / MariaDB | 3306 | ? |
Yes |
| SQL Server | 1433 | @p1, @p2… |
No, only the statement check |
| Oracle | 1521 | :1, :2… |
No, only the statement check |
Creating a SQL connection
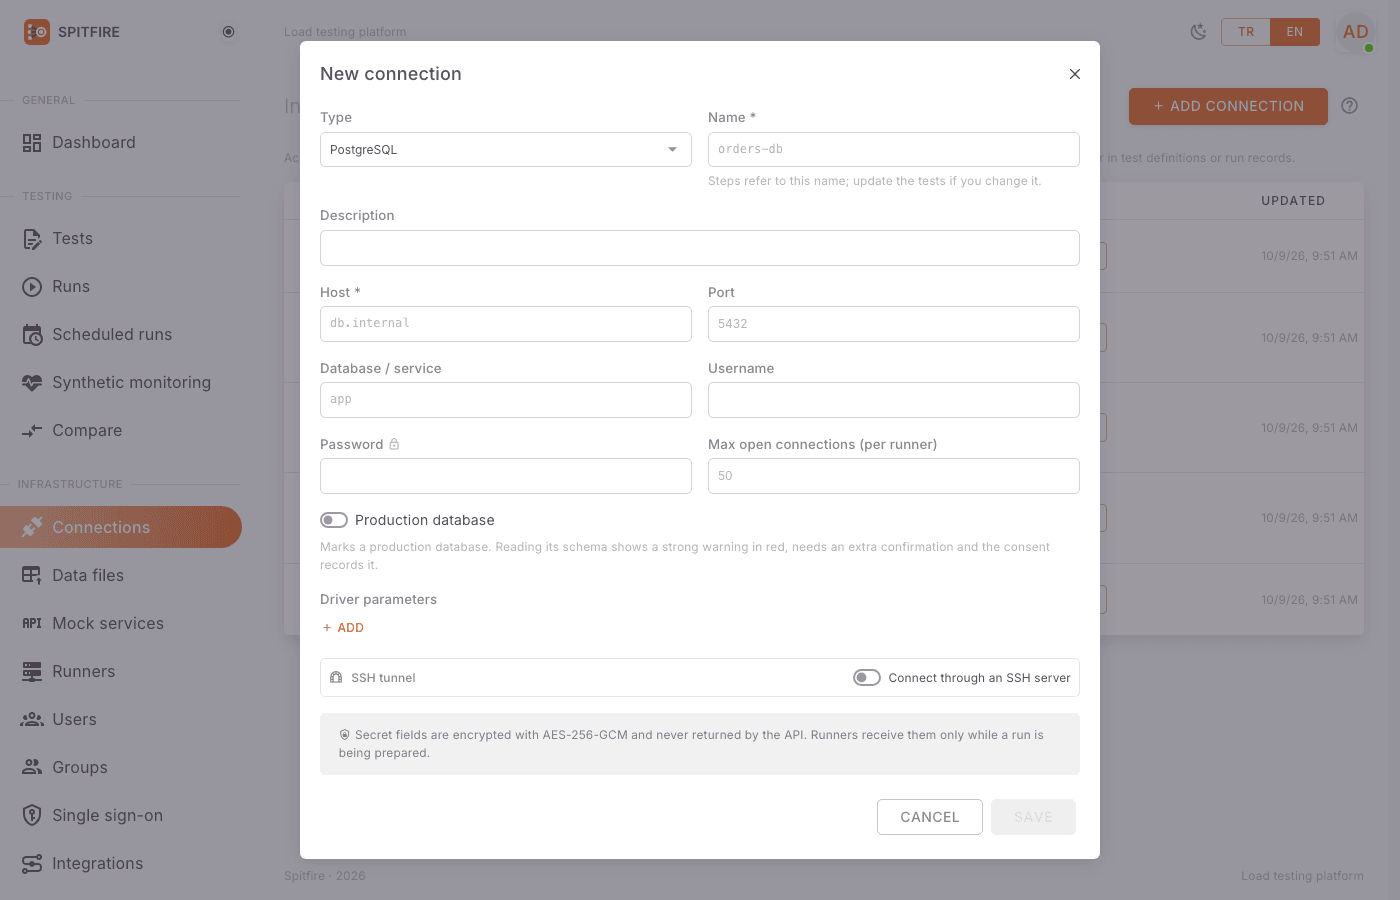 New PostgreSQL connection
- Click Connections → Add connection.
- Type: PostgreSQL, MySQL / MariaDB, SQL Server or Oracle.
- Name: e.g.
orders-db. - Host: the database's host name or IP (required). With an SSH tunnel, this name is resolved on the SSH server's side.
- Port: empty means the type's default.
- Database / service: the database name; for Oracle the service name (e.g.
FREEPDB1). - Username and Password (a secret). If you can, use a separate user with
SELECTonly on the tables you need. - Max open connections (per runner): the most database connections each runner opens for this connection; default 50. If you run many VUs and the database's
max_connectionsis low, set it accordingly: total connections ≈ number of runners × this value. - Production database: tick it when the connection goes to production. The list shows a red PRODUCTION badge; reading the schema shows a strong warning and needs an extra confirmation.
- Driver parameters: key/value pairs passed to the driver. Add rows with Add. Examples: PostgreSQL
sslmode=require; SQL Serverencrypt=true. - If the database is reachable only through a bastion, use the SSH tunnel section (installation admins only; see SQL: SSH tunnel).
- Save, then Test.
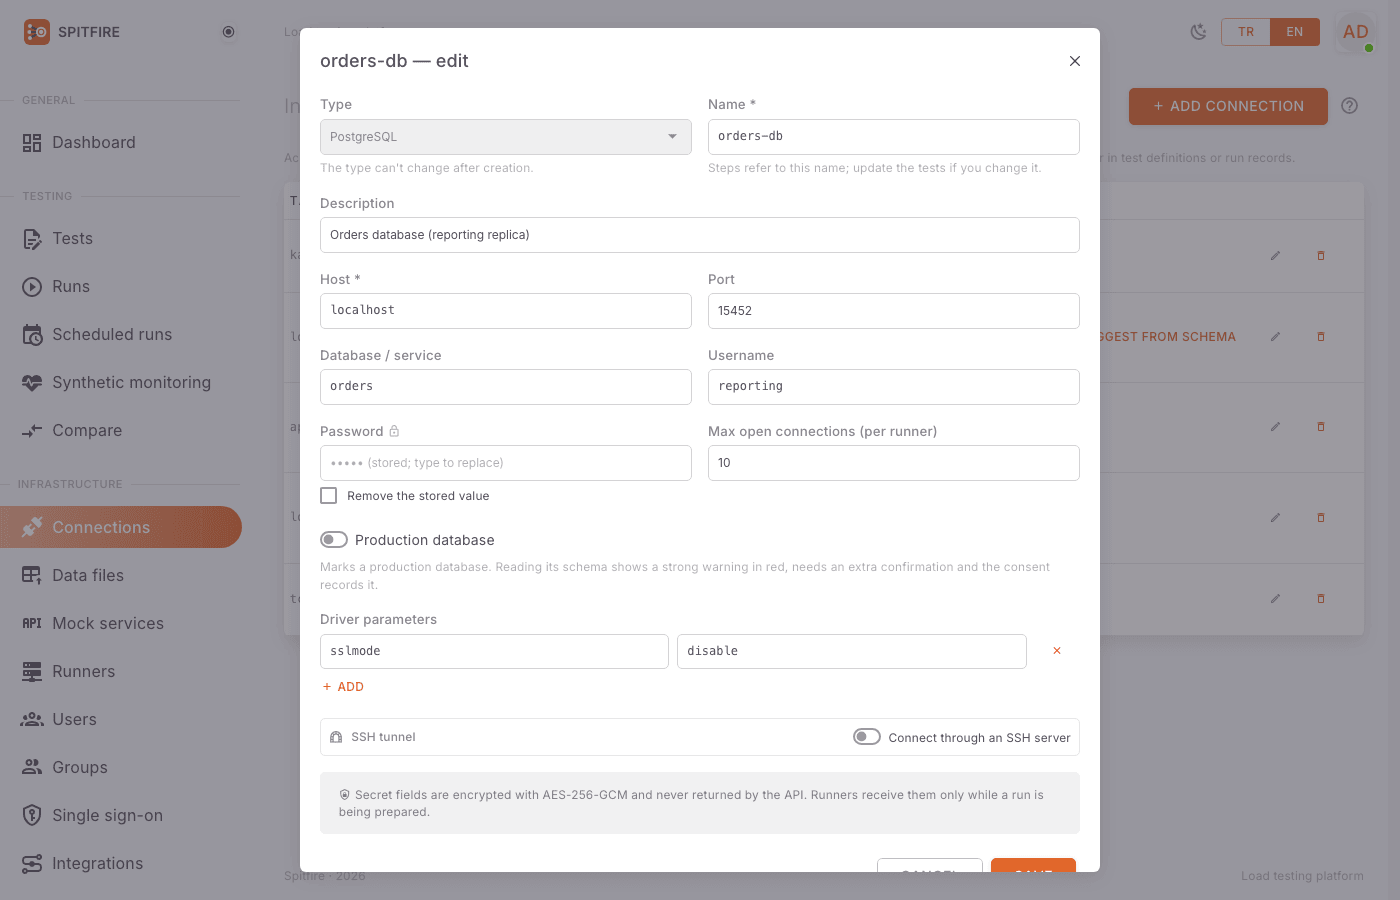 Editing a SQL connection
Single query step
- In the test editor: Add step → Protocol: SQL.
- Connection: e.g.
orders-db. The connection's type decides the placeholder style. - Keep Single query selected in the Query type buttons.
- Write the query in Query. Don't put values in the query; use parameters (Don't put values in the query; use parameters ($1).).
- Under Parameters, use Add parameter to give a value for each placeholder (
#1,#2…). Values may be templates:{{customerId}}, a CSV data column{{customers.id}}, fake data{{fake.firstName}}, a random number{{$randInt 1 100000}}. - Max rows kept (default 100): how many rows checks and extraction see. More rows are counted but not read.
- For a read, the form shows the green note Read-only: runs in a read-only transaction; any write attempt is rejected by the database. (PostgreSQL and MySQL).
- In the Checks tab add e.g. Row count = 1. Rows come back as a JSON array; in Extract you can take a column value with a JSONPath such as
$[0].status. - Run a single iteration with Try it to see the rows returned, then Save.
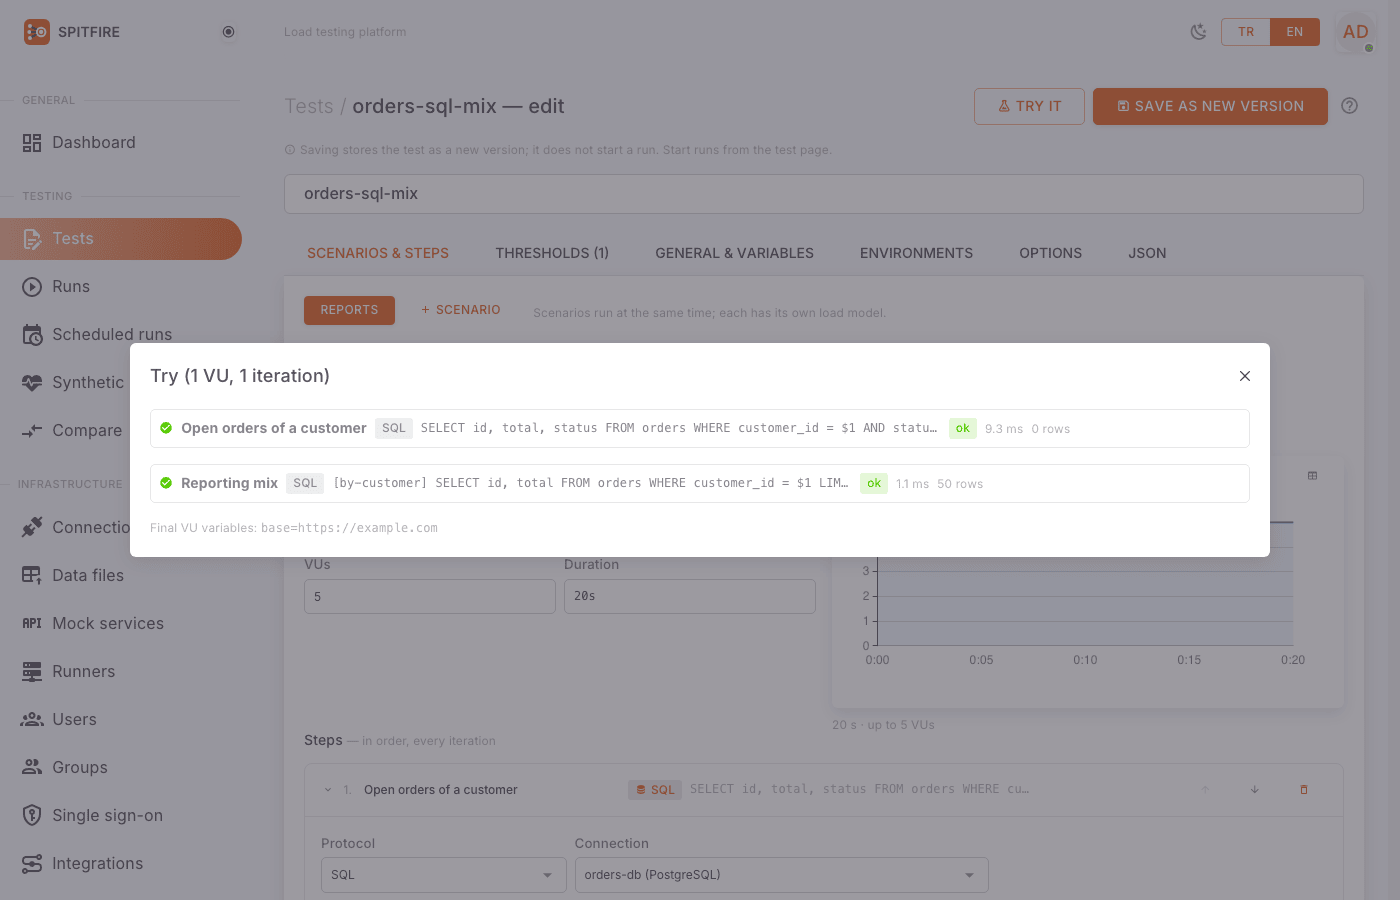 Try result
{"id": "order", "name": "Get order", "protocol": "sql", "connection": "orders-db",
 "sql": {"query": "SELECT id, status, total FROM orders WHERE id = $1", "params": ["{{$randInt 1 100000}}"]},
 "extract": [{"var": "status", "from": "jsonpath", "expr": "$[0].status"}],
 "checks": [{"type": "rowCount", "op": "eq", "value": 1}]}
On other databases only the placeholder changes:
[
  {"id": "my", "name": "MySQL", "protocol": "sql", "connection": "mysql-db",
   "sql": {"query": "SELECT * FROM customers WHERE email = ?", "params": ["user{{__VU}}@example.com"]}},
  {"id": "ms", "name": "SQL Server", "protocol": "sql", "connection": "mssql-db",
   "sql": {"query": "SELECT TOP 10 * FROM Orders WHERE CustomerId = @p1", "params": ["{{__VU}}"]}}
]Query mix
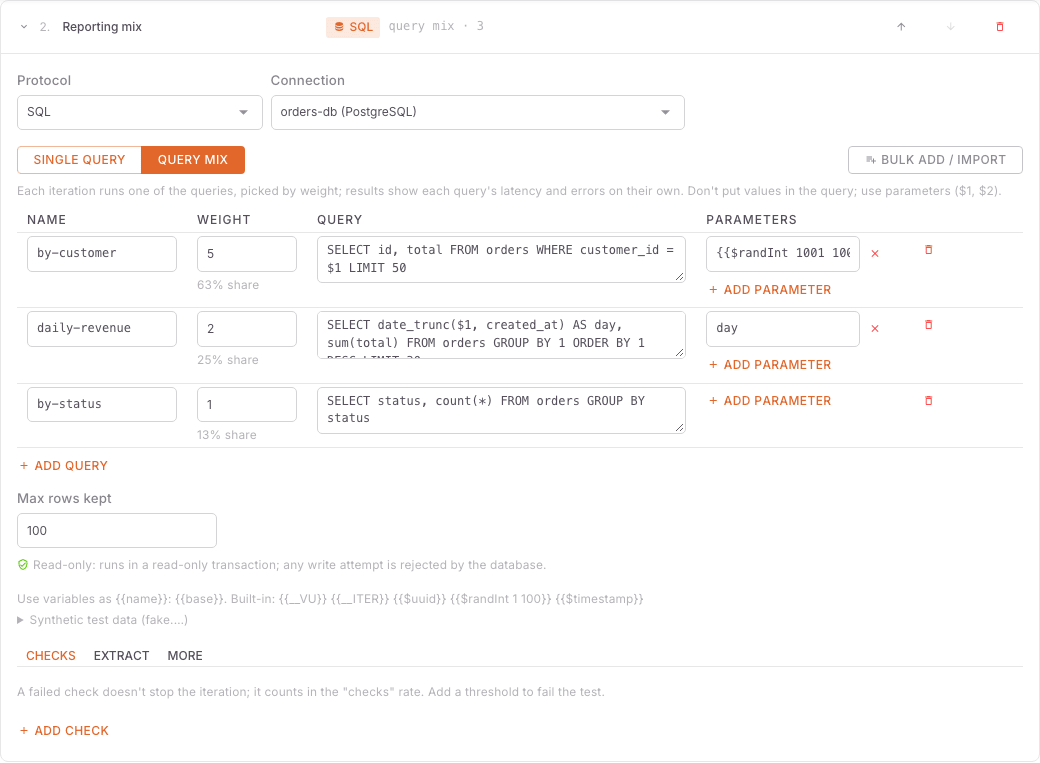 Query mix step
- In the SQL step pick Query mix as the Query type. If a query is already written, it becomes the mix's first entry, named
query_1with weight 1. - Add a row per query with Add query, or fill the mix with Bulk add / import.
- For each row:
- Name: unique, at most 80 characters, no template (e.g.
byId,search). Result tables and threshold filters use this name. - Weight: a positive whole number. Weights are relative; the row shows it as …% share. Call counts from
pg_stat_statementswork as they are. - Query and its parameters.
- Name: unique, at most 80 characters, no template (e.g.
- A mix holds at most 200 queries.
- If a query in the mix modifies data, its row says This query modifies data and the step shows the checkbox Queries in this mix modify data, I approve. That one approval covers every write in the mix.
{"id": "catalog", "name": "Catalog queries", "protocol": "sql", "connection": "orders-db",
 "sql": {"mix": [
   {"name": "byId",   "query": "SELECT * FROM products WHERE id = $1", "params": ["{{$randInt 1 5000}}"], "weight": 120000},
   {"name": "search", "query": "SELECT * FROM products WHERE name ILIKE $1 LIMIT 20", "params": ["%{{fake.firstName}}%"], "weight": 30000}
 ]}}
In this example about 80% of the iterations run byId and 20% run search.
A step with a mix has no query and params of its own (a step with a query mix has no query or params of its own).
Bulk add
The Bulk add / import button opens the SQL bulk add dialog. The first tab is Statements / .sql file:
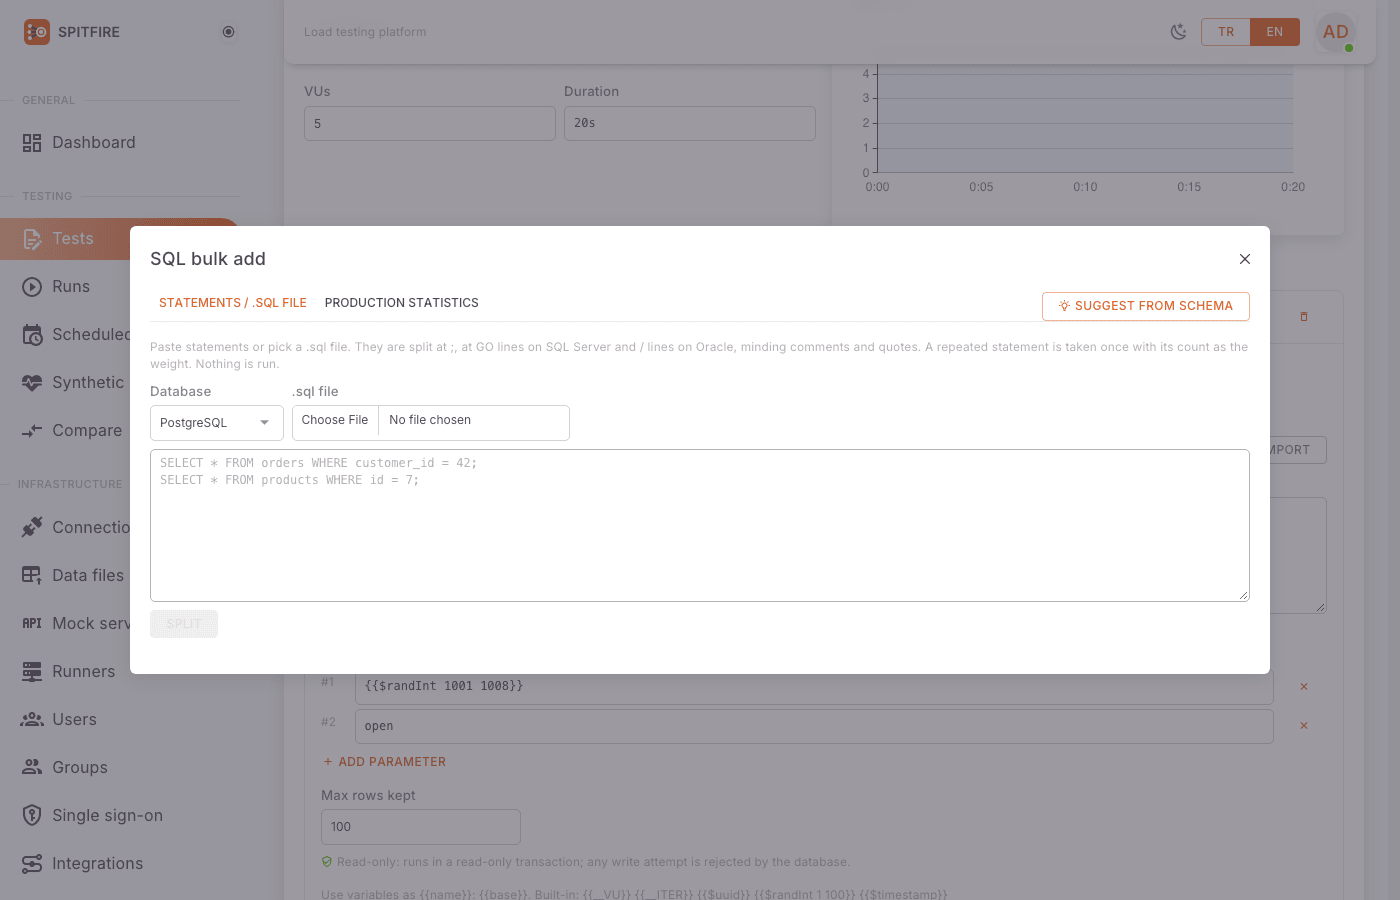 SQL bulk add dialog
- Pick the dialect in Database (PostgreSQL, MySQL / MariaDB, SQL Server, Oracle). The splitting rules depend on it.
- Paste the statements into the text area, or pick a file in .sql file.
- Click Split. Nothing is run; the controller only splits the text into statements:
- at
;outside quotes and comments, - minding PostgreSQL dollar quotes (
$ … $) and nested comments, - MySQL
#comments andDELIMITER, - SQL Server
GOlines, - Oracle
/lines and PL/SQL blocks.
- at
- The review table shows each distinct statement once: Line (in the file), Name, Statement, Count (how often it occurred; it becomes the weight), Kind and Parameter values. The summary above reads N statements: X reads, Y writes.
- Kind: read, write, lock (such as
SELECT … FOR UPDATE), INTO (SELECT … INTOcreates a table), procedure (CALL/EXEC; unknown side effects), several statements. - Reads come selected, everything else unselected. Change the selection with Reads only, All, None, or row by row. If you select a statement that is not a read, a red warning appears below: N selected statements modify data or lock rows; the step will need the "modifies data" approval.
- Pick the Output: One query mix step or One step per statement.
- Click Add (N).
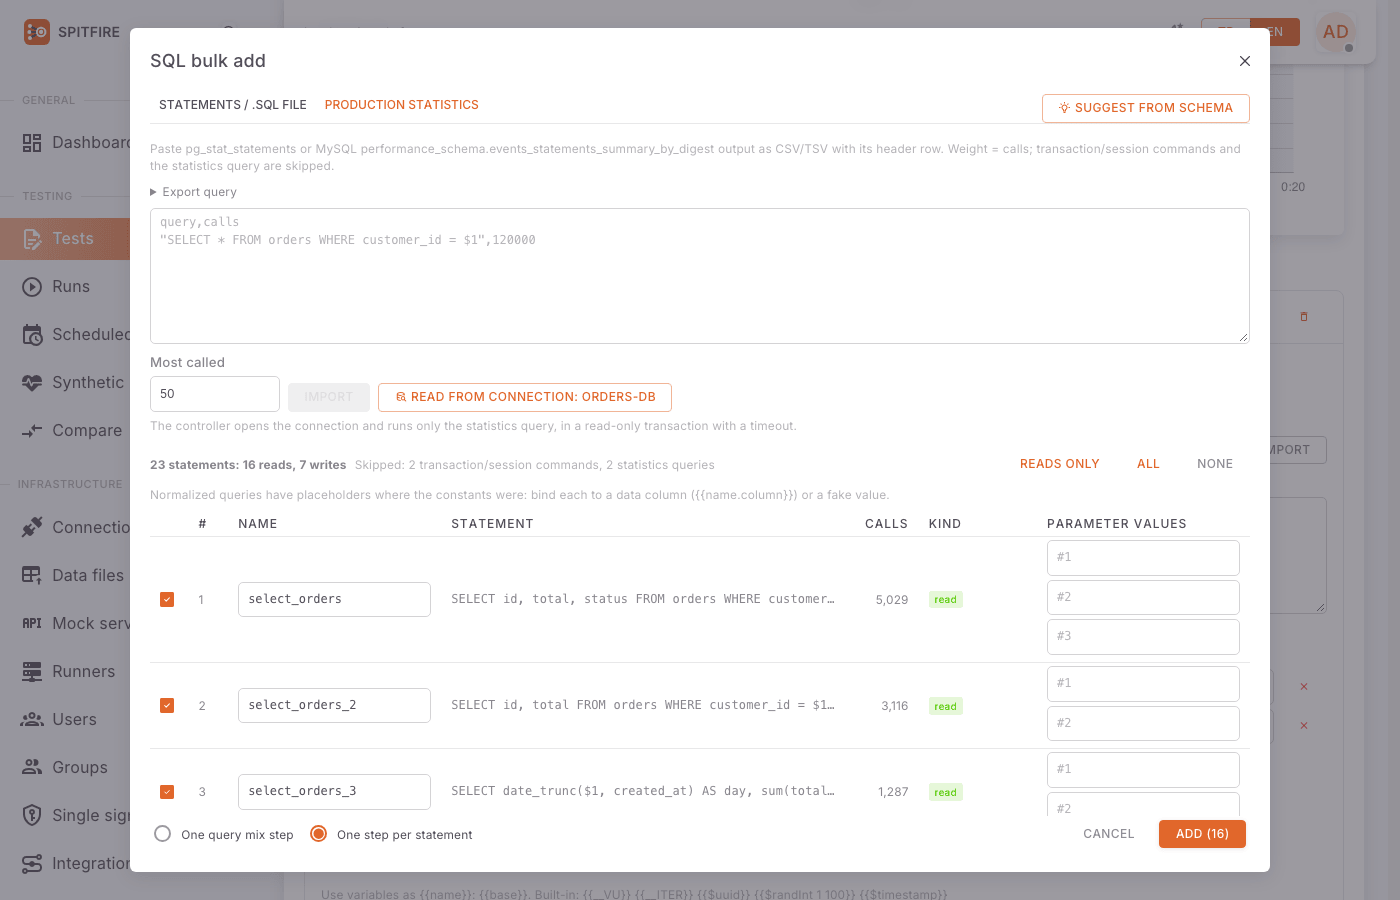 Bulk add review table
Importing production statistics
The Production statistics tab of the same dialog takes the queries your database really runs most, with their call counts:
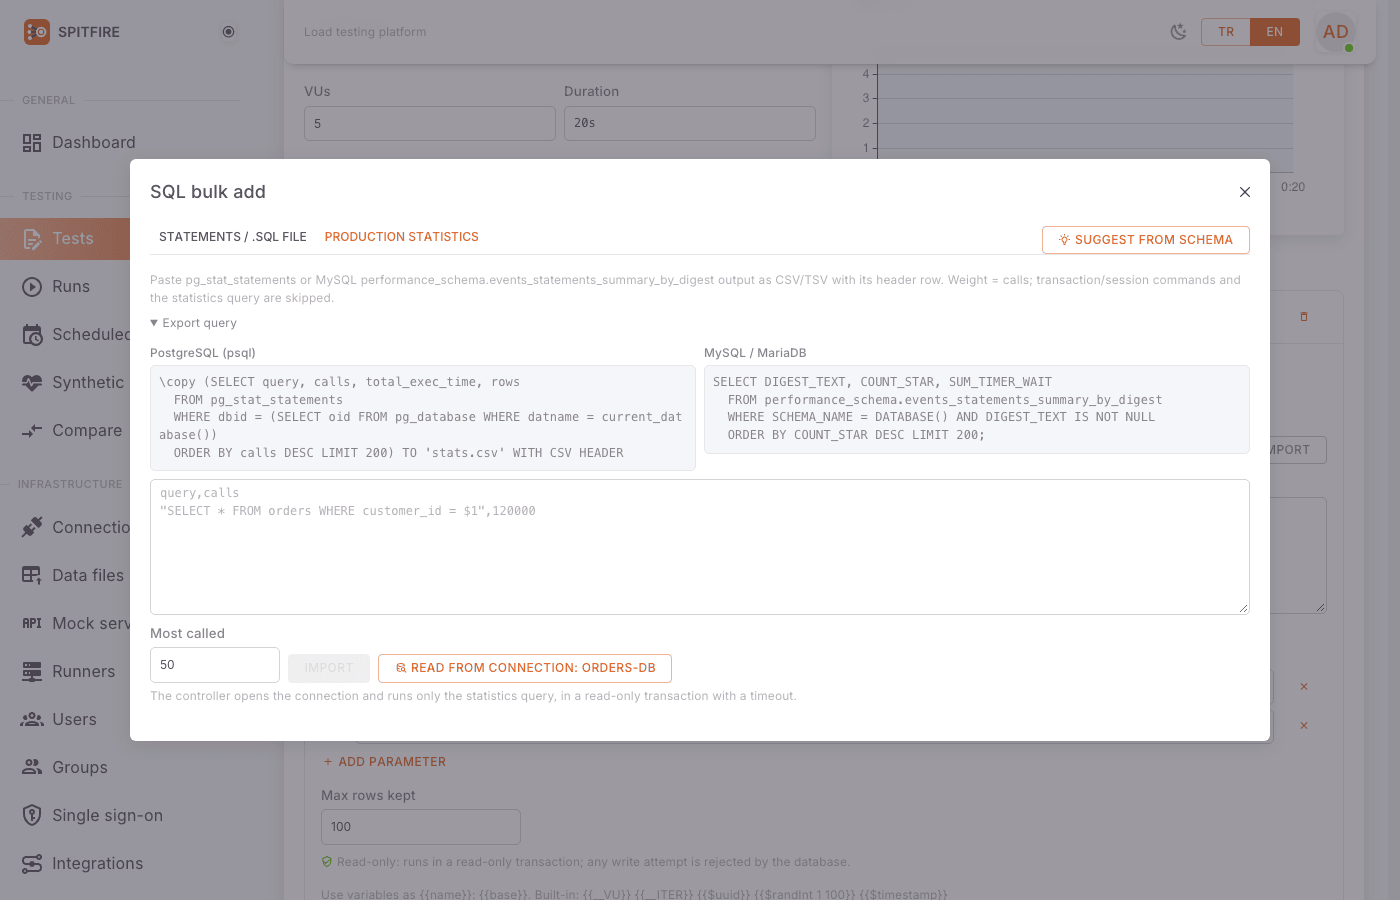 Production statistics tab
Method A — paste CSV/TSV (any user):
- Expand Export query; ready-made queries are shown for PostgreSQL (psql) and MySQL / MariaDB:
- PostgreSQL: a
\copycommand that writes the columnsquery, calls, total_exec_time, rowsfrompg_stat_statementsfor the current database, top 200 by calls, tostats.csv. Thepg_stat_statementsextension must be installed and loaded. - MySQL:
DIGEST_TEXT, COUNT_STAR, SUM_TIMER_WAITfromperformance_schema.events_statements_summary_by_digest.
- PostgreSQL: a
- Run the query in your own client; paste the output with its header row into the text area.
- Choose how many queries to take in Most called (default 50, at most 200).
- Click Import.
Method B — read directly from the connection (admins only, PostgreSQL and MySQL):
- When the step's connection is PostgreSQL or MySQL, a Read from connection: orders-db button appears.
- Click it. The controller opens the connection and runs only the statistics query, top N rows by calls, inside a read-only transaction with a timeout.
With both methods:
- Call counts become weights.
- Transaction and session commands (
BEGIN,COMMIT,SET…) and the statistics query itself are skipped; the Skipped: … line counts them. - Writes come unselected.
- Normalized queries have placeholders (
$1,?) where the constants were. In the Parameter values column bind each to a data column ({{name.column}}) or a fake value; the field offers suggestions. - MySQL's collapsed lists (
IN (...)) are flagged A collapsed value list (IN (...)): edit the query after adding it., cut texts The statistics cut the query text: complete it after adding it.
The Suggest from schema tab at the top right of the dialog (installation admins only) suggests queries from the database schema: SQL: query suggestions from the schema.
Per-query results
Every SQL step produces these step-level metrics:
| Metric | Meaning |
|---|---|
req_duration |
The query's time (ms) |
req_failed |
Rate of failed queries |
reqs |
Queries run |
rows |
Rows returned or affected |
In a query mix every query also produces its own series; the query's name is the series' check label:
| Metric | Meaning |
|---|---|
sql_query_duration |
Time per query |
sql_query_failed |
Error rate per query |
The SQL query mix card on the run page lists each query's Calls, Share and Error rate; the step's total is in the step table above it. The same appears in the HTML/PDF report and the CLI summary. To put a threshold on a single query:
[
  {"metric": "sql_query_duration", "filter": {"check": "search"}, "expr": "p(95)<200"},
  {"metric": "sql_query_failed", "expr": "rate<0.01"}
]Write protection
What counts as a write
The write guard tokenizes each query per the database's syntax (comments, quotes, separators) and counts keywords only where a statement starts: the beginning, the body of a CTE, the statement after a CTE list or EXPLAIN, a subquery. So a replace() function or a column named update does not turn a read into a write.
| Kind | Examples |
|---|---|
| Read | SELECT, SHOW, EXPLAIN, DESCRIBE, VALUES, TABLE, WITH … SELECT |
| Write | INSERT, UPDATE, DELETE, MERGE, UPSERT, REPLACE, TRUNCATE, DROP, CREATE, ALTER (on SQL Server also GRANT, REVOKE, DENY, BULK, DBCC) |
| Lock | SELECT … FOR UPDATE, FOR SHARE, FOR KEY SHARE; SQL Server hints UPDLOCK, XLOCK, HOLDLOCK, TABLOCKX |
| INTO | SELECT … INTO (creates or fills a table) |
| Procedure | CALL, EXEC, EXECUTE, DO (unknown side effects) |
| Several statements | More than one statement, at least one of which writes |
The classification is conservative: anything not recognized as a read is a write.
Approvals
- On the step. For a query that is not a read, the step shows This statement modifies data, I approve (in a mix Queries in this mix modify data, I approve). The test cannot be saved without it; the error reads: this statement modifies data (UPDATE); tick "modifies data" to allow it. The editor also lists warnings such as writes to the database (INSERT) on every iteration and locks rows (FOR UPDATE); concurrent VUs will block each other.
- On a try. When you press Try it, the Try a test that modifies data dialog lists the operations that change data; continue with I understand, try it.
- On every run. A run does not start until you tick I understand this test changes real data; start it in the run dialog (or the approval is given on a phone). Scheduled runs and comparison runs have their own confirmation checkboxes too.
{"id": "audit", "name": "Write audit row", "protocol": "sql", "connection": "orders-db",
"sql": {"query": "INSERT INTO audit_log (vu, at) VALUES ($1, now())", "params": ["{{__VU}}"], "allowWrite": true}}Read-only transaction
The write guard is the first line of defence. On PostgreSQL and MySQL / MariaDB every query classified as a read also runs inside a read-only transaction; a side effect that slips through (e.g. a function that changes data) is rejected by the database itself.
SQL Server and Oracle have no such transaction mode. With these connections, a SQL step's form shows: SQL Server: reads on this database do not run in a read-only transaction; only the statement check protects it. Use a read-only database user. On these databases the only reliable protection is a connection user with read rights only (db_datareader / SELECT only).
Common problems
Symptom: Test: connection refused or a timeout.
Cause: Wrong host/port, the database is only reachable from an internal network, or a firewall blocks it.
Fix: Check port and host; allow the controller and runner IPs; behind a bastion use an SSH tunnel.
Symptom: password authentication failed for user … (PostgreSQL), Access denied for user … (MySQL), Login failed for user … (SQL Server), ORA-01017 (Oracle).
Cause: Wrong username/password, or the user has no access to that database.
Fix: Type the password again and save; check Database / service. On PostgreSQL make sure pg_hba.conf allows the controller/runner IP.
Symptom: no pg_hba.conf entry … SSL off or a SQL Server TLS error.
Cause: The server requires an encrypted connection.
Fix: Add sslmode = require (PostgreSQL) or encrypt = true (SQL Server) to Driver parameters.
Symptom: ORA-12514: listener does not currently know of service.
Cause: Wrong Oracle service name.
Fix: Write the service name, not the SID, in Database / service (e.g. FREEPDB1).
Symptom: Saving shows this statement modifies data (…); tick "modifies data" to allow it.
Cause: The query was not recognized as a read (write, lock, INTO, procedure or several statements).
Fix: If you really mean to write, tick the approval. If it should be a read, simplify it: drop FOR UPDATE, use a plain SELECT instead of a procedure, split several statements into separate steps.
Symptom: During the run cannot execute … in a read-only transaction (PostgreSQL) or Cannot execute statement in a READ ONLY transaction (MySQL).
Cause: A query that looks like a read tried to change data (e.g. a function with side effects).
Fix: This protection works on purpose. If the write is intended, mark the query as a write and approve it; otherwise change the function.
Symptom: The run won't start: This test modifies data; confirm to continue. Cause: The test has an approved write. Fix: Tick I understand this test changes real data; start it in the run dialog.
Symptom: too many connections / remaining connection slots are reserved.
Cause: Number of runners × Max open connections (per runner) exceeds the database's limit.
Fix: Lower Max open connections (per runner) or raise the database's connection limit.
Symptom: Saving shows query search of the mix modifies data… or weight must be a positive whole number. Cause: An unapproved write in the mix, or an invalid weight. Fix: Tick the mix approval or remove the write; make weights whole numbers of 1 or more.
Symptom: No Read from connection button. Cause: The connection is SQL Server/Oracle, or your account is not an admin. Fix: Use Method A (paste CSV).