Version: 0.21.0This documentation is for Spitfire 0.21.0.
Mock services, chaos and capacity planning
This page covers three separate tools:
- Mock services — mocks that answer in place of outside APIs such as payment, SMS or cargo providers; the load test neither wears out nor gets billed by the real providers.
- Fault injection under load (chaos) — deleting pods or adding network latency in Kubernetes during a run, and measuring how long the system takes to recover.
- Capacity planning — an estimate of "how many pods for X users?" from a breakpoint run.
Mock services
What it does
If the system under test calls a payment provider, an SMS service or a cargo API during a load test, those calls must not reach the real provider: they are billed, rate-limited, and real SMS go out. Mock services answer in their place:
- Every service answers under a slug (
http://<mock-host>:8472/<slug>/…) on endpoints (a method and a path pattern such as/v1/orders/:id) with a templated response (status, headers, body). - It waits with the chosen latency distribution (fixed, uniform, normal or log-normal with p50/p95; at most 60 s), imitating the real provider's latency.
- At the error rate you set it returns an error with its own status and body: you see how your system behaves on provider errors, under load.
- Ready templates: iyzico (test double), PayTR (test double), SMS provider (generic) and Cargo API (generic).
These are mocks, not the providers' services: no payment is taken, no SMS or shipment is created. The templates resemble public API contracts; they have no tie to the providers.
When to use it
- When your test environment depends on an outside service whose test environment cannot take load.
- When you want to measure, in a controlled way, how an outside service's slowness or errors affect your system (e.g. what happens when the payment provider's p95 is 800 ms?).
First: turn the mock listener on
The mock listener is off by default (it is in every plan). You can save definitions, but with the listener off nothing answers; the page says The mock listener is off. Two options:
A) Inside the controller (Docker install):
- In the install folder add
SPITFIRE_MOCK_ADDR=:8472todeploy/docker/.env. - In
deploy/docker/docker-compose.ymluncomment the ready line (# - "8472:8472") under the controller'sports. - Restart the controller (e.g. by running the install command again).
- The page should say "The controller serves the mock services on …".
- If the system under test reaches the controller by another name (e.g. an internal DNS name), set
the shown address with
SPITFIRE_MOCK_PUBLIC_URL(e.g.http://spitfire.internal:8472).
After updating the installer bundle, check that the port line is still uncommented.
B) As a separate container (close to the system under test, from the same image):
docker run -p 8472:8472 -e SPITFIRE_URL -e SPITFIRE_TOKEN algebransoft/spitfire spitfire mockIt fetches the definitions with an API token and refreshes them every 30 s (--refresh). On a network
without internet you can take the file with Export JSON on the page and serve it:
spitfire mock --file mock-services.jsonIts counters are then at /_spitfire/stats on the mock address (not on the page).
Creating a mock service
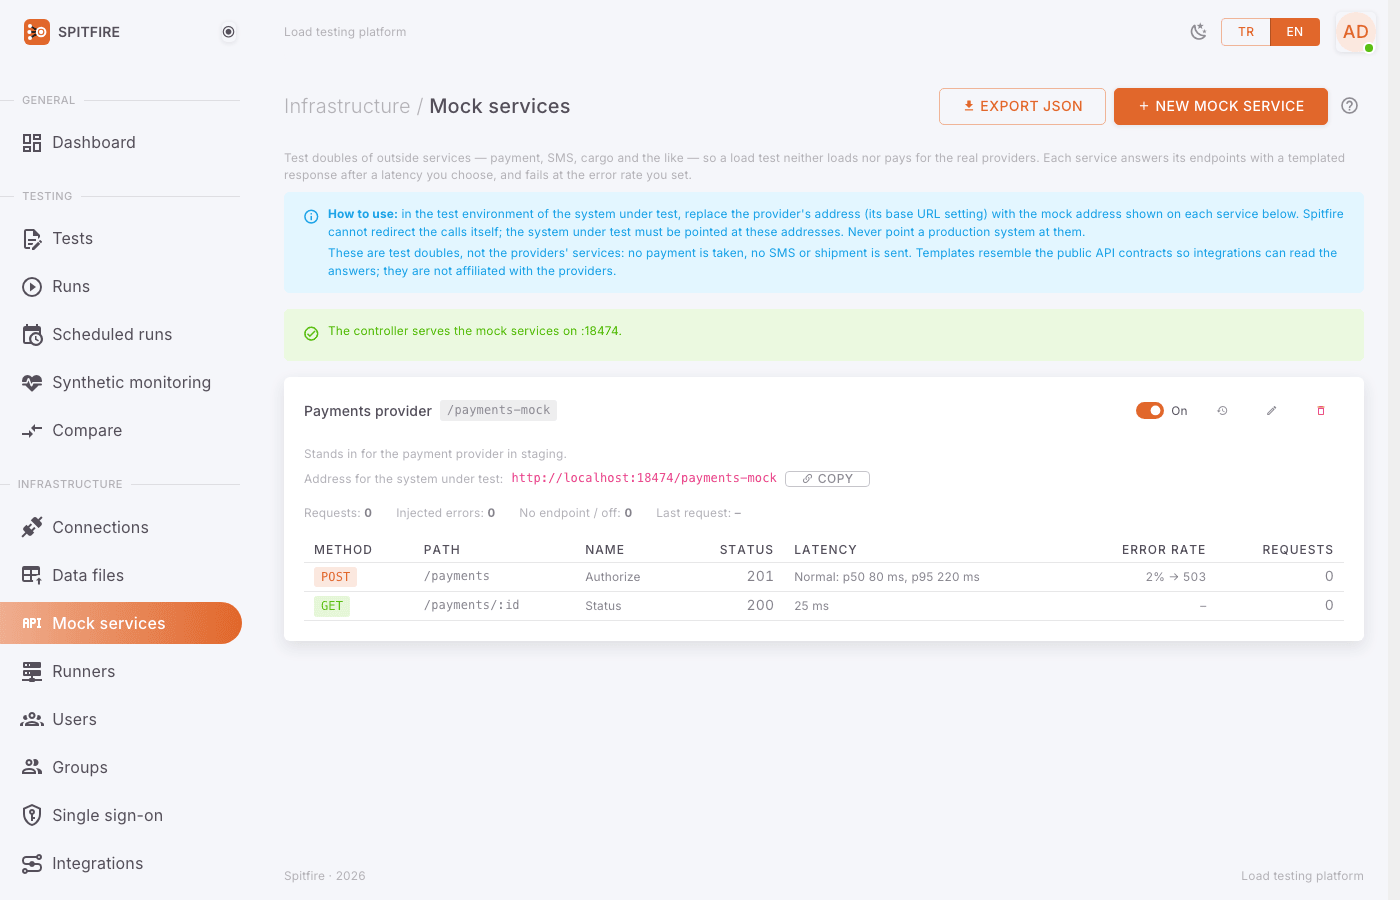 Mock services page
- Open Infrastructure → Mock services in the left menu.
- Press New mock service. In the Start from dialog pick a template: iyzico, PayTR, SMS, cargo or Empty service (one endpoint to start with). You can change every endpoint before saving.
- Give it a Name and a Path prefix (slug). The service answers under
/<slug>/on the mock address (e.g. slugpayment→http://mock-host:8472/payment/…). - In Endpoints, for each endpoint:
- Method (ANY matches every method) and Path: fixed text, a parameter for one segment
(
/v1/orders/:id) and a trailing*for the rest. The first matching endpoint answers. - Status (e.g. 200).
- Response headers: one per line,
Name: value. - Response body: with placeholders (below).
- Latency: None, Fixed, Uniform (Min (ms), Max (ms)), Normal or Log-normal (with p50 and p95). Log-normal gives a long right tail, like real services.
- Error rate, Error status and Error body: that share of requests gets the error instead (after the same latency).
- Add endpoint for another.
- Method (ANY matches every method) and Path: fixed text, a parameter for one segment
(
- Press Save.
- The service card shows the Address for the system under test; take it with Copy.
- Point the system under test at this address: put it in the provider's base URL setting in the test environment. Spitfire cannot redirect those calls itself.
- Send a request and see it under Recent requests (the last 50, refreshed every 2 s; bodies and headers are not kept).
 New mock service: choosing a template
Never point a production system at the mock addresses.
Response body placeholders:
| Placeholder | Value |
|---|---|
{{request.body.conversationId}} |
a JSON field (nested as a.b.0.c) or a form field |
{{request.query.x}} |
a query parameter |
{{request.header.X-Id}} |
a request header |
{{request.params.id}} |
a path parameter (/v1/orders/:id) |
{{request.method}}, {{request.path}} |
the method, the path |
{{request.body.price|1.0}} |
the default after | when empty |
{{$uuid}}, {{$timestamp}}, {{$isoTimestamp}}, {{$randInt 1 100}}, {{fake.tckn}}… |
the scenario's built-in values |
With a JSON Content-Type, request values are escaped for JSON strings.
Counters on the service card: Requests, Injected errors (from the error rate), No endpoint / off and Last request. Turn off (answers 503) turns the service off without deleting it; Turn on turns it back on. Creating, changing, turning on/off and deleting a mock service goes into the audit log.
Fault injection under load (chaos)
What it does
If the system under test runs in Kubernetes, a run can delete pods at a chosen moment (the Deployment or StatefulSet starts new ones) or add network latency to them. The run measures the recovery time: from the injection (for latency, from the end of the fault) until the run's p95 and error rate are back within the limits you set, for the hold time (5 s by default). A second in which no request completed never counts as recovered.
When to use it
- "If a checkout pod dies under load, for how long do users see errors?"
- "If the path to the database gets 200 ms slower, what happens to p95, and does the system recover?"
Requirements
- The Spitfire controller must run in Kubernetes, in a cluster that reaches the system under test. Otherwise it says "Fault injection is unavailable: the controller does not run in Kubernetes".
- Network latency needs an image with
tc(iproute2) your cluster can pull. Without it only pod deletion is offered. - Namespaces enforcing the baseline or restricted Pod Security Standard refuse
NET_ADMIN; only pod deletion works there.
Safety: off by default, guarded at every step
Turning it on, step by step:
- An admin enables it for the installation: on the Runners page, in the Fault injection under load (Kubernetes) card, tick Allow fault injection on this installation.
- Enter the Allowed namespaces, comma-separated (test environments). Never the whole cluster: a
namespace is always required,
kube-*namespaces are refused even when listed, and Spitfire's own pods are never touched. - Optionally enter the Image for network latency (optional) and the Interface. The image runs
as an ephemeral container with
NET_ADMIN. - Kubernetes must allow it too. The controller's service account has no rights outside its own
namespace. A cluster operator applies
deploy/kubernetes/fault-injection.yamlto every allowed namespace (pod get/list/delete,pods/ephemeralcontainerspatch), and deletes it to take the rights back.
Injecting a fault in a run
- Press Run on the test page (admins only; not with an API token).
- Turn on Inject faults during the run (Kubernetes) and press Add a fault.
- For each fault:
- Action: Delete pods or Network latency ("needs a tc image" when there is none).
- Namespace: one of the allowed ones.
- Label selector: required, e.g.
app=checkoutortier in (web). - At: seconds from the run's start (before its planned end).
- Pods: how many (1–50).
- For network latency, Latency (1–10000 ms) and For (5–1800 s).
- The recovery limits: Recovered: p95 ≤ … and errors ≤ … for … s (1–60).
- Dry run: show matching pods shows the pods the selector matches now: "Would act on M of N running pods". The pods are picked at random among the running ones when the fault's moment comes; the list may change until then.
- Tick "I understand that this run deletes or disrupts real pods … in the namespaces below".
- Type the namespaces to confirm (comma-separated).
- Start. The confirmation goes into the audit log before the run exists; if the audit log cannot be written, the run does not start.
Reading the result
The Fault injection card on the run page and the report list, per fault: At, Fault (e.g. "delete 2 pods", "+200 ms for 60 s"), Status (scheduled, injected, failed, skipped), the pods it hit, Worst p95, Worst error rate and Recovery — "12 s", "no measurable impact" or "not recovered by …". Every injection also shows in the run log and the audit log.
The settings and scope are checked again at the moment of injection: turning the feature off or narrowing the namespaces applies to running runs too. A run that stops first skips the pending faults.
Capacity planning
What it does
On the page of a finished breakpoint run, the Capacity planning card scales the breaking point it found to a target number of concurrent users: "For 5,000 concurrent users ≈ 18 instances (range 15–18)". This is an ESTIMATE — not a measurement; the card states every assumption it rests on.
Step by step
- First make a breakpoint run: on the test page, Run → Find the breaking point (capacity test). Enter Start, Step, Up to, Step length, p95 limit and Error rate limit, and start it.
- When it ends, find the Capacity planning card on its page.
- Instances during the run: the pods or servers behind the tested endpoint during the run. Spitfire does not see the system; you enter this number.
- Target concurrent users: the number of users you plan for.
- Iterations/s per user: left empty, it comes from the run (one user = one of the test's virtual users, think time included; Little's law). You can enter your own value.
- Spare capacity: 0–90%.
- Read the result: the headline, the range, the Confidence (low or medium; never higher than medium, since linear scaling itself was not measured), Assumptions and What the data supports.
- Optionally Save on the run: the saved inputs put this estimate, with its assumptions, in the run report.
Assumptions and limits
- Linear scaling up to the breaking point: an instance carries what it carried at the breaking point, and shared dependencies (database, cache, queues, outside services) do not saturate first.
- Users behave like the test's scenario (a breakpoint run runs one scenario).
- The real breaking point lies between the last step that held and the step that failed; the range shows both ends.
- If no step failed, or the load generator ran out of VUs, the number is an upper bound ("at most").
- A load generator with saturated CPU, and a target far beyond the measured breaking point, lower the confidence.
- The tested system's resource metrics (CPU, memory) are not used in this estimate; the card says it rests on throughput only.
Common problems
| Symptom | Cause | Fix |
|---|---|---|
| The mock listener is off. | SPITFIRE_MOCK_ADDR not set |
Follow option A or B above. |
| The system under test cannot reach the mock | Port 8472 not published, or the shown address is not a name the system can reach | Uncomment the port line in Compose; set SPITFIRE_MOCK_PUBLIC_URL to the name the system uses; check the firewall. |
The mock answers 404 |
The slug or path does not match, or the service was deleted | Look for no match rows under Recent requests; fix the path pattern and slug. |
The mock answers 503 |
The service is Off | Press Turn on. |
A separate spitfire mock serves old definitions |
It refreshes every 30 s | Wait 30 s or lower --refresh; with --file, export the file again. |
| A placeholder comes out empty | Wrong field name, or not in the request | Add a |default; check the JSON path (a.b.0.c). |
| "Fault injection is unavailable…" | The controller is not in Kubernetes | The feature works only with a controller in Kubernetes. |
| "Kubernetes refused or could not be reached" | fault-injection.yaml not applied to that namespace |
A cluster operator applies the file to the namespace. |
| Only Delete pods can be chosen | No tc image, or the namespace refuses NET_ADMIN |
Set the image; check the Pod Security Standard. |
| "The fault is not allowed" | Namespace not allowed, kube-*, or an empty selector |
Use an allowed namespace and a narrowing label selector. |
| "Capacity estimates come from a breakpoint run." | The run is a plain run | Make a new run with Find the breaking point (capacity test). |
| "No step of this breakpoint run held…" | Even the first step failed the criteria | Run again with a lower start. |
Related pages
- Observability — which resource saturated when it broke
- Version comparison — both arms' breaking points side by side
- Troubleshooting
- Mock services
In Spitfire: /mock-services· RunnersIn Spitfire: /runners